STATISTICS FOR MANAGERS
 |
| Summer 2015 |
|
Graduate (s) Business Administration 502 STATISTICS FOR MANAGERS |
|
|
|
| | HOME | SYLLABUS | CALENDAR | ASSIGNMENTS | ABOUT PROF. GIN | |
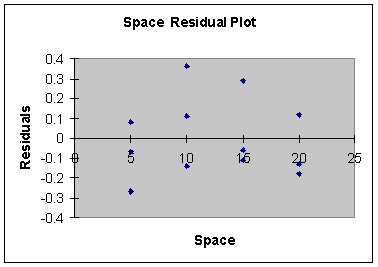
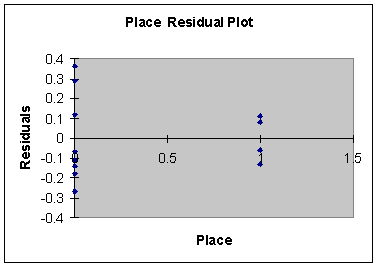
Answers, Ch. 1414.41 a. Salesi = ß0 + ß1 Spacei + ß2 Locationi + €i * * * b. Salesi = 130 + 7.4 Spacei + 45 Locationi b1 = 7.4 => Sales will increase by $7.40 for every 1 foot increase in shelf space, holding the location constant b2 = 45 => Sales will increase by $45 if the display is at the front of the aisle as opposed to the back, holding the amount of space constant * * * c. Sales = 130 + 7.4 (8) + 45 (0) = $189.20 * * * d. Heteroscedasticity Neither of the residual plots (for space or for place (location)) shows the fan shape that would be indicative of heteroscedasticity
Autocorrelation n = 12, k = 2,
d = 2.38 => No autocorrelation Multicollinearity VIF < 5 => No multicollinearity 5 < VIF < 10 => Uncertain VIF > 10 => Multicollinearity VIF = 1.00 => No multicollinearity * * * e. H0: ß1 = ß2 = 0 H1: At least one ßj does not equal 0 Alpha = 0.05, n = 12 F k, n - k - 1 = (SSR / k) / (SSE / (n - k - 1)) Alpha = 0.05 => Reject H0 if F 2, 12 - 2 - 1 > 4.26 F 2, 12 - 2 - 1 = 28.53 > 4.26 => Reject H0, accept H1 * * * f. H0: ßj = 0 H1: ßj ≠ 0 Alpha = 0.05, n = 12
Alpha = 0.05 => Reject H0 if t12 - 2 - 1 > 2.2622 or < -2.2622 ß1: t12 - 2 - 1 = 6.72 > 2.2622 => Reject H0, accept H1 ß2: t12 - 2 - 1 = 3.45 > 2.2622 => Reject H0, accept H1 * * * g. βj ≈ bj ± tn-k-1 Sbj 95% C.I. => t12 - 2 - 1 = 2.2622 ß1 ~ 7.4 ± 2.2622 (1.1)
ß2 ~ 45 ± 2.2622 (13)
* * * i. r2 = 0.86 => 86% of the variation in sales is explained by the multiple regression model with shelf space and location as independent variables * * * j. radj2 = 0.83 * * * m. The slope of shelf space with sales is the same regardless of whether the display is in the front or the back of the store.
|