|
B. Neighborhoods
1. Segregation
a. Measurement
-
Dissimilarity
Index - the proportion
of members of one group that would have to change
their area of residence to achieve an even
distribution
.
.
.
.
Race / Ethnicity
|
Dissimilarity
Index (D)
|
American Indian
|
39.8
|
Asian
|
51.5
|
Black
|
63.6
|
Hispanic
|
61.1
|
.
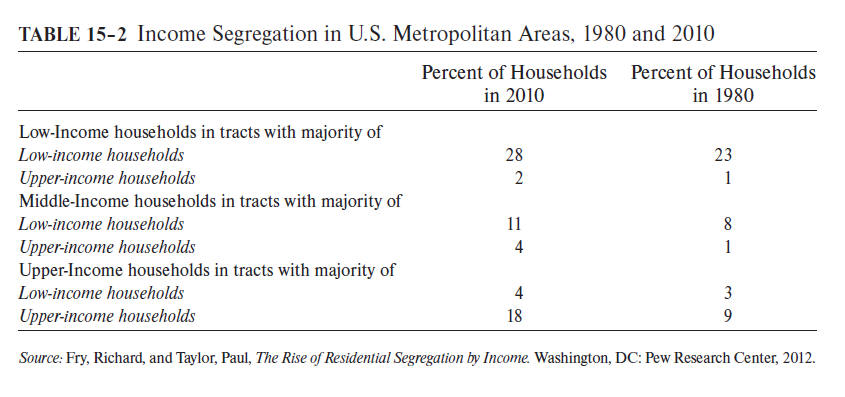
b. Income segregation
-
Low income households - Dissimilarity Index
= 27 - 47 in large metro areas, 17 - 49 in all metro areas
-
Becoming more segregated by income over
time

.
c. Education segregation
-
High school dropouts - Dissimilarity Index
= 24 - 45 in large metro areas, 10 - 50 in all metro areas
-
College graduates - Dissimilarity Index =
28 - 43 in large metro areas, 14 - 44 in all metro areas
.
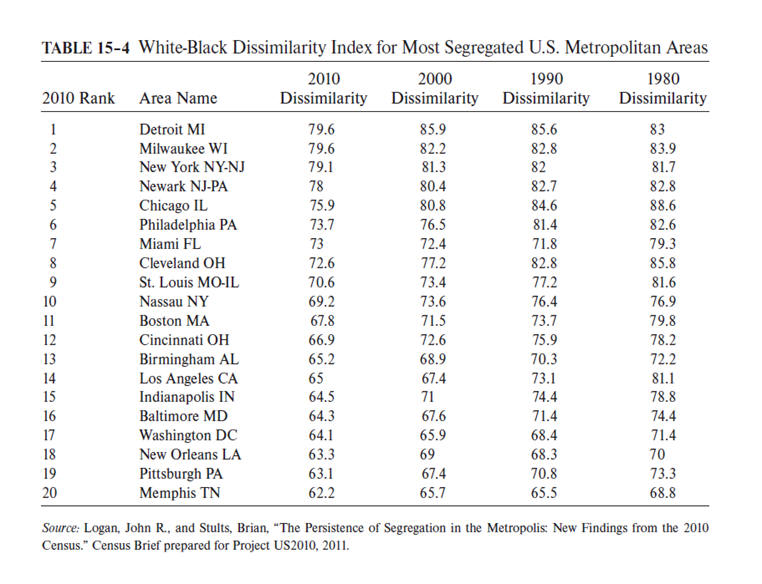
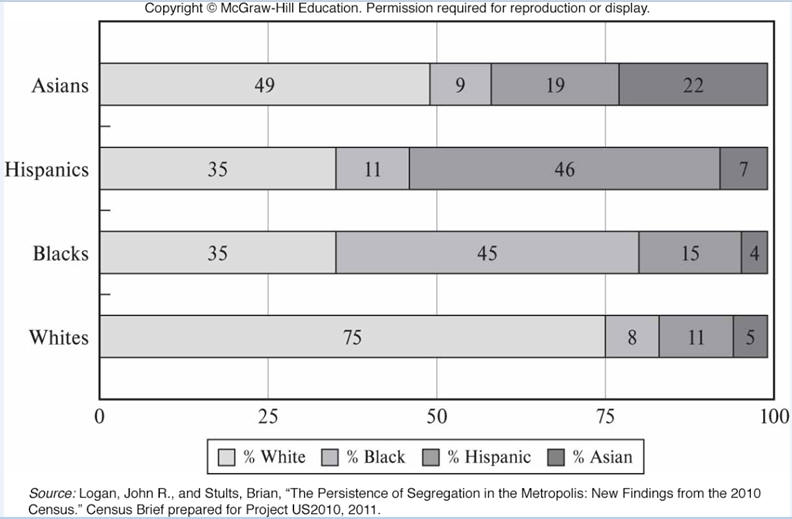
d. Racial segregation

-
Actual distribution of U.S. population: 58
percent White, 14 percent Black, 19 percent Hispanic, 7 percent
Asian

2. Sorting for local
public goods
a. Diversity in demand for local public
goods
-
People will differ in their desired levels
of local public goods
-
Ex. - Police and fire, parks, libraries,
class sizes
.
.
.
.
.
.
.
.
.
.
-
Voting leads to median quantity chosen
-
Most people will be unhappy with the result
-
Leads to people moving to cities with the
desired level of local public goods (Tiebout hypothesis)
.
b. Diversity in demand for a taxed good
.
.
.
.
.
.
.
.
.
3. Bidding for favorable neighbors
a. Neighborhood externalities
.
(1) Children
.
(2) Adults
.
b. Equilibrium
.
(1) Segregation equilibrium
.
.
.
.
.
.
.
.
.
.
(2) Integration equilibrium
.
.
.
.
.
.
.
.
.
.
(3) Mixed neighborhoods
.
.
.
.
.
.
.
.
.
.
(4) Lot size and public policy
- Suppose lot size can vary
.
.
.
.
.
.
.
.
.
.
.
|


