|
E. Crime
1. Crime facts
a. FBI index crimes
- Personal crime - victim placed
in physical danger (homicide, rape, aggravated assault) or
show of force used to coerce victim to steal property
(robbery)
- Property crime - burglary
(illegal entry of a building), larceny, auto theft
.
| |
Crimes per 100,000 people |
| |
1960 |
1970 |
1980 |
1990 |
2000 |
2010 |
2014 |
| Personal Crime |
|
|
|
|
|
|
|
| Murder |
5.0
|
7.8
|
10.2
|
9.4
|
8.2
|
4.8 |
4.5 |
|
Rape
|
9.5
|
18.6
|
36.8
|
41.2
|
37.1
|
27.7 |
26.4 |
|
Aggravated assault
|
85.2
|
176.9
|
298.5
|
424.1
|
418.3
|
252.8 |
232.5 |
|
Robbery
|
59.5
|
187.2
|
251.1
|
257.0
|
220.9
|
119.3 |
102.2 |
|
|
|
|
|
|
|
|
|
|
Property Crime
|
|
|
|
|
|
|
|
|
Auto theft
|
182
|
457
|
502
|
658
|
561
|
239 |
216 |
|
Larceny
|
1,024
|
2,124
|
3,167
|
3,184
|
3,045
|
2,006 |
1,837 |
|
Burglary
|
504
|
1,152
|
1,684
|
1,236
|
988
|
701 |
543 |
|
|
|
|
|
|
|
|
|
|
Total index crimes
|
1,870
|
3,949
|
5,950
|
5,820
|
5,278
|
3,350 |
2,962 |
.
- Not counted: disorderly conduct,
shoplifting, arson, employee theft, possession and sale of
narcotics, public drunkenness, drunk driving
.
b. Victims of crime

.
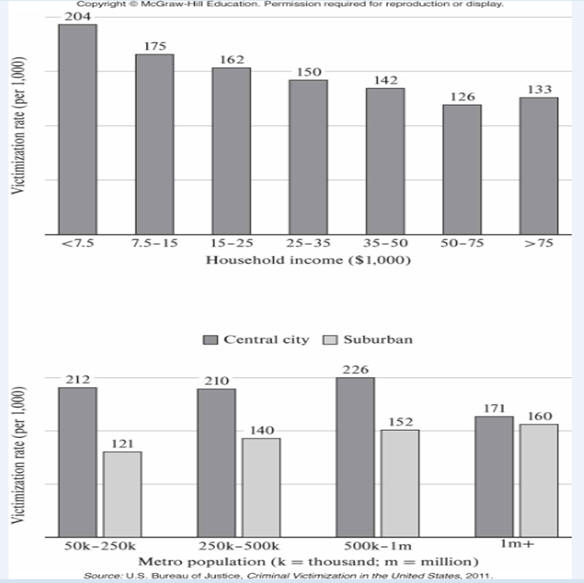
(1) Income
- Violent crime - rate decreases as
income increases
- Property crime - mixed results
.
(2) Place of residence
- Highest in central cities, lowest
in rural areas
.
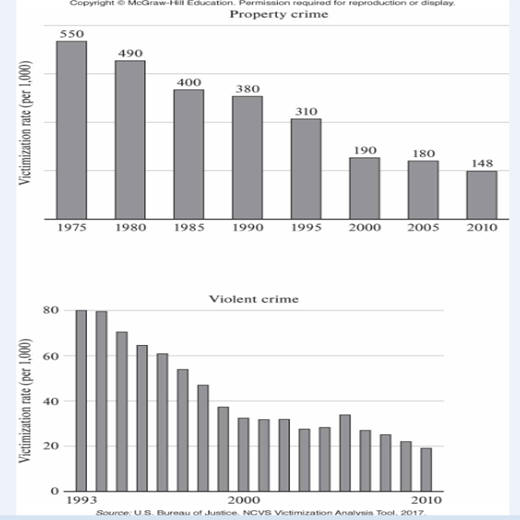
c. Trends

.
2. Rational criminal model
a. Expected utility from committing a crime
-
Positive - loot from crime
-
Negative - loss of income if caught and
incarcerated
-
Utility affected by the probability of being
caught and incarcerated
-
Certainty equivalent = expected utility of
committing a crime
.
.
.
.
.
.
b. Equilibrium amount of crime committed
.
.
.
.
.
.
.
.
.
.
c. Anguish cost
.
.
.
.
.
.
.
.
.
.
3. Public policy
a. Invest in human capital
.
.
.
.
.
.
.
.
.
.
-
Elasticity of crime with
respect to wages of low-skilled workers is between -1.0 and -2.0
-
High school graduation reduces crime
participation rate of white males (9 percent for violent
crime, 5 percent for drug crime, 10 percent for property
crime), reduces arrest rate (elasticity of -2.0 for
violent crime and -1.3 for vehicle theft)
.
b. Increase certainty of punishment
.
.
.
.
.
.
.
.
.
.
c. Increase severity of
punishment
.
.
.
.
.
.
.
.
.
.
(1) Present bias - future costs
underestimated
(2) Aging criminals - frequency of crime
decreases with age
(3) Hardening the criminal - prison time
reduces anguish cost
(4) Prison schooling - prisoners learn from
each other, reduces probability of being caught
.
4. Role of prisons in reducing crime
- Elasticity of crime with respect to
prison population = -0.25 for property crime and -0.40 for
violent crime
a. Deterrence
- Certainty of punishment a greater
deterrence than severity of punishment
- Length of time served doesn't reduce
crime
.
b. Incapacitation
- Take criminals out of circulation
- 17 to 21 crimes avoided by keeping
typical criminal in prison for one year
- Marginal benefit = $15,000, marginal
cost of imprisonment = $36,000 per year
- Reduced fear, reduced expenditures on
security not counted
.
c. Rehabilitation
- Provide criminals with skills and
attitudes necessary to succeed outside of prison
- Studies show that rehabilitation
programs are usually ineffective
- Difficult to change antisocial
attitudes
- Convicts committed to crime by the
time they are in prison
- Difficult for criminals to get
equally lucrative legal opportunities
- Anticrime programs targeted on youths
pass benefit-cost test
.
5. Efficient level and mix
of crime
a. Efficient amount of crime
- Crime prevention has a cost => optimum
amount of crime to allow is positive
- Compare benefit of prevention with cost
.
.
.
.
.
.
.
.
.
.
b. Crime substitution
- Change in penalty will affected quantity
and mix of crime
.
.
.
.
.
.
.
.
.
.
b. Principle of marginal deterrence
- Penalties should increase with victim
cost of crime
.
.
.
|


