|
E. Population
1. Population growth dynamics
-
Population growth has been slow through most
of human history
-
Accelerated in the last 200 years
-
Particularly rapid in developing countries
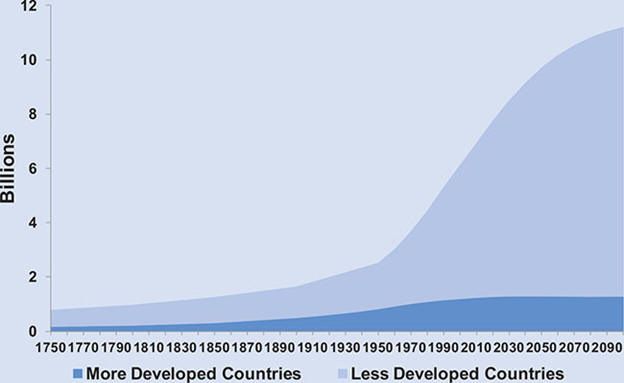
Global population growth and projections, 1750 -
2100
.
| |
1950s |
1960s |
1970s |
1980s |
1990s |
2000s |
2010s |
| Population growth rate (%) |
1.80 |
2.00 |
1.90 |
1.80 |
1.40 |
1.23 |
1.18 |
| Average annual increase (millions) |
50.6 |
65.7 |
75.6 |
85.3 |
81.6 |
76.5 |
83.8 |
.
| |
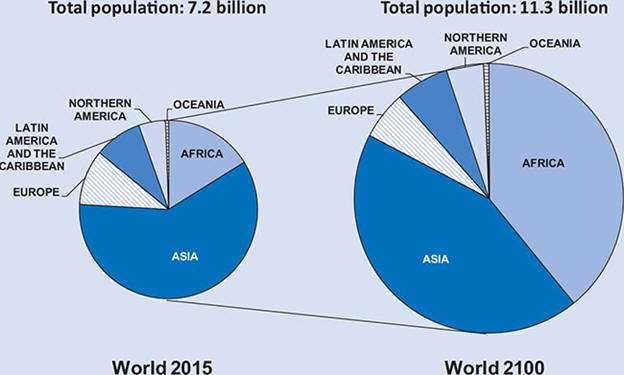
Population (millions) |
| Major Area |
2015 |
2030 |
2050 |
2100 |
| World |
7,349 |
8,501 |
9,725 |
11,213 |
| Africa |
1,186 |
1,679 |
2,478 |
4,387 |
| Asia |
4,393 |
4,923 |
5,267 |
4,889 |
| Europe |
738 |
734 |
707 |
646 |
| Latin America and Caribbean |
634 |
721 |
784 |
721 |
| Northern America |
358 |
396 |
433 |
500 |
| Oceania |
39 |
47 |
57 |
71 |
.
.
.
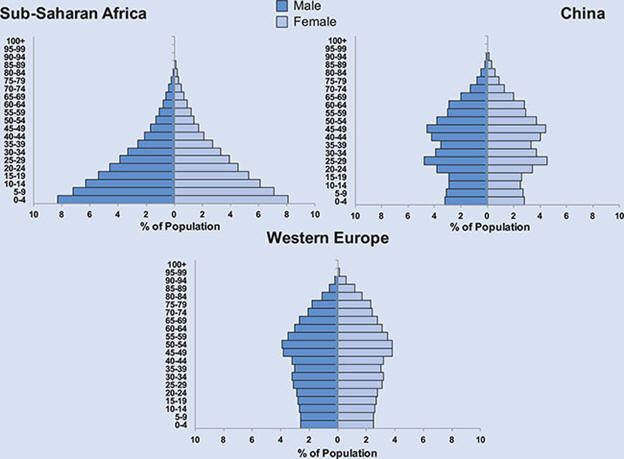
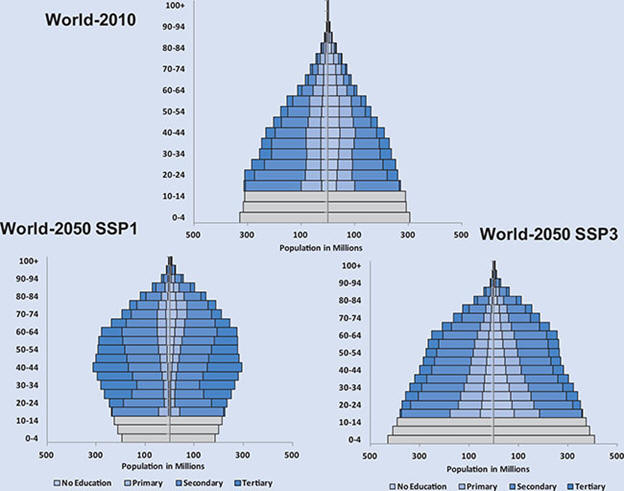
2. Predicting future growth
-
Look at population age profile
-
Population
momentum - the tendency for a population to continue to grow,
even if fertility rate drops to replacement level, as long as a high
proportion of the population is in young age cohorts
.
.
.
.
.
.
.
.
-
Fertility rate
- average number of live births per woman
-
Replacement
fertility level - fertility level that would result in a
stable population (a little over 2 live births per woman)
-
Fertility rate high in developing countries
- Niger (7.6), Mali (6.4), Nigeria (5.7), Afghanistan (5.1), Iraq
(4.6), Guatemala (3.3)
-
Profiles can be affected by education
.
3. Demographic transition
a. Stage I - high birthrates and high
death rates
.
b. Stage II - death rates fall rapidly
-
Industrialization leads to improved standard
of living, public health, and medical care
-
Families still large - children a source of
support both in the present and in the future
-
Population grows rapidly
-
Could be okay in a country has resources and
social institutions that can handle the population growth
.
c. Stage III - birthrates decline
-
Changing social and cultural atmospere means smaller families seen
as more desirable
-
Part of change is that women are empowered
=> opportunity cost of childbearing is increased
-
Starts with most educated part of society
and then spreads
-
Population growth rates decline
.
d. Stage IV - low birthrates and low death
rates
.
.
.
.
.
.
.
.
.
.
.
4. Population growth and economic growth
.
a. Cobb-Douglas production function
.
.
.
.
.
b. Natural resource limitation
.
.
.
.
c. Negative economic impacts of population
growth
(1) Increased dependency ratios - high
proportion of children not in workforce
(2) Increase income inequality - increased
supply of labor drives down wages, could lead to unemployment increasing
(3) Natural resource limitation - leads to
diminishing returns
(4) Market failure - common resource leads
to overuse, as does not factoring in negative externalities
.
5. Ecological perspective
.
a. Carrying capacity
-
The level of population and consumption that
can be sustained by the available natural resource base
-
Ecological approach views growth is limited
by the carrying capacity
-
Humans have been able to expand carrying
capacity - fertilizers, fossil fuel and nuclear energy
-
Significant ecological cost to expanding
carrying capacity, which could ultimately reduce it:
(1) Climate change
(2) Buildup of long-lived toxic waste
(3) Erosion and degradation of topsoil
(4) Overuse and pollution of fresh water
supplies, including depletion of aquifers
(5) Loss of biodiversity
.
b. Impact of population, affluence, and
technology
.
.
.
.
.
.
-
Population, affluence, and technology could
be related to one another instead of being independent
-
Unequal distribution of consumption
throughout the world => some focus should be on inequality
-
As development occurs, per capita demand on
resources and pollution will result
.
6. Population policies
Ex. - One child policy in China
.
a. Policies
(1) Promotion of education and other
social programs
(2) Improvement in the status of women
(3) Improved nutrition and health care,
including contraception
.
b. Impact on urban areas
(1) Inadequate housing and sanitation
(2) Congestion
(3) Air and water pollution
(4) Deforestation
(5) Solid waste problems
(6) Soil contamination
.
|