Economics 308

ENVIRONMENTAL AND NATURAL RESOURCE ECONOMICS

Fall 2019
 
| HOME | SYLLABUS | CALENDAR | ASSIGNMENTS | ABOUT PROF. GIN |
 

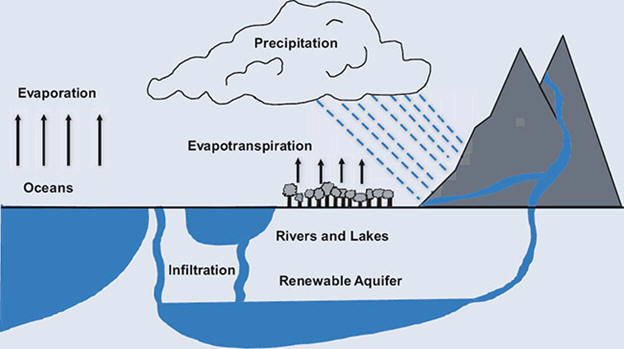
D.  Water

1.  Water facts

  • Earth's water - oceans = 97%, fresh water = 3%

  • Fresh water - glaciers and ice caps = 70%, underground aquifers = 29%, rivers and lakes = 1%

  • Hydrologic cycle

.

  • Surface water renewable, but aquifers not on a human time scale

  • 2,000 cubic meters of water needed per person per year

  • Water distributed unevenly geographically and seasonally

.

2.  Classification of scarcity

a.  Water stressed - countries where freshwater supplies are between 1,700 and 1,000 cubic meters per person per year

b.  Water scarce - countries where freshwater supplies are less than 1,000 cubic meters per person per year

c.  Absolute water scarcity - countries where freshwater supplies are less than 500 cubic meters per person per year

.

Water availability per region 2012
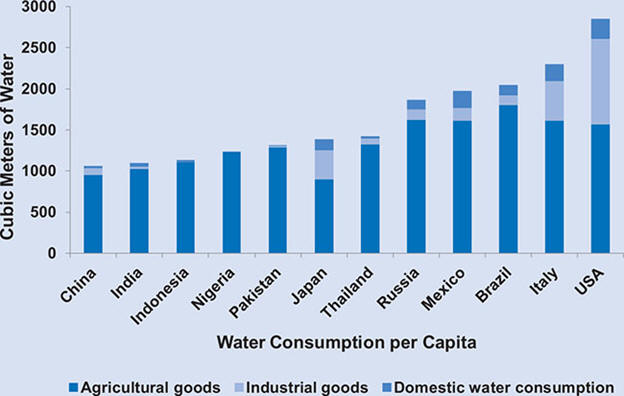
  • Region Cubic meters per person (average)

    Middle East and North Africa

    500
    Sub-Saharan Africa 1,000
    Caribbean 2,466
    Asia /  Pacific 2,970
    Europe 4,741
    Latin America 7,200
    North America (including Mexico) 13, 401

.

3.  Water demand

  • Global water withdrawals - agriculture = 70%, industry = 20%, domestic = 10%

  • 20% of cropland requires irrigation, produces 40% of food

  • U.S. - irrigation = 41% of water withdrawals, industry (including electricity generation) = 46%

.

a.  Virtual water

  • Water use inbedded in a good or service throughout the production process

Product Virtual water content (liters)
1 sheet of paper (80 g/m2) 10
1 tomato (70 g) 13
1 slice of bread (30 g) 40
1 orange (100 g) 50
1 apple (100 g) 70
1 glass of beer (250 ml) 75
1 glass of wine (125 ml) 120
1 egg (40 g) 135
1 glass of orange juice (200 ml) 170
1 bag of potato crisps (200 g) 185
1 glass of milk (200 ml) 200
1 hamburger (150 g) 2,400
1 pair of shoes (bovine leather) 8,000

.

  • Water footprint - total amount of water consumed by a human entity, including virtual water

National Water Footprint for Selected Countries, 1997–2001 (in Cubic Meters per Person per Year)

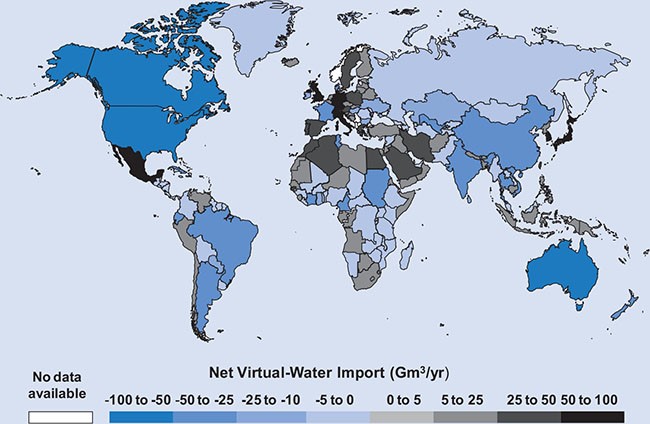
.

b.  Virtual water trade

  • Virtual water means trade in goods leads to trade in water

.

  • Exporting virtual water affects local hydrological cycle

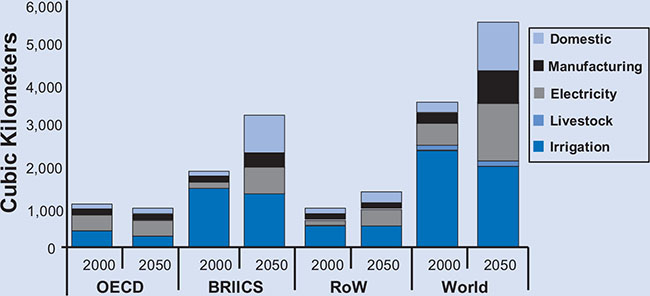
.

c.  Projected water demand

  • Global water demand expected to increase by 55 percent between 2000 and 2050

  • Most growth will be in developing countries

  • Access to safe drinking water expanding in developing countries

Global Water Demand, 2000 and 2050

.

4.  Dealing with water shortages

a.  Increasing water supplies

(1)  Extracting groundwater from aquifers

  • Extraction is exceeding recharge

  • Key aquifers becoming depleted

.

(2)  Building dams

  • Captures floodwater, prevents flooding

  • Provides hydroelectric power, irrigation, and recreation

  • Environmental and social damage - reduces biodiversity, reduce fish population, lower crop production, disrupt flow of nutrients, contribute to global warming, affect water supplies, displace population

.

(3) Desalination

  • Remove salt from seawater

  • More expensive than surface water and groundwater

.

b.  Managing water demand

(1)  Microirrigation

  • Use small amounts of water closer to plants

  • More efficient than traditional irrigation

.

(2)  Recycling and reuse of wastewater

  • "Graywater" - laundry and bathing water can be reused for irrigation

.

(3)  Water use standards

  • Dishwashers, washers, toilets, showerheads

.

(4)  Conservation

  • Cheapest way to address water shortages

  • Nonprice approaces:


(a)  Required or voluntary adoption of water conserving technologies

  • Set standards, offer rebates, free items (e.g., showerheads)

.

(b)  Mandatory water use restrictions

  • Limits on lawn watering, washing cars, filling swimming pools

.

(c)  Education and information

  • Mailings, public events, public service messages

.

(d)  Innovative institutional design of common-property resources

  • Traditional patterns of communal water use

.

c.  Water pricing

  • Water utilities either publicly or privately owned

  • Average cost pricing is usually used - set price equal to average cost

  • Efficiency requires price = marginal cost

  • Natural monopoly:

.

.

.

.

.

.

.

.

.

.

.

  • Water use often subsidized

.

(1)  Groundwater

  • Nonrenewable resource

  • External cost on future generation if water used in current generation

.

.

.

.

.

.

.

.

.

.

(2)  Welfare impacts

  • External cost due to environmental impacts

.

.

.

.

.

.

.

.

.

.

(3)  Pricing structure

(a)  Uniform rate structure - price per unit is constant

(b)  Increasing block structure - price per unit increases as amount used increases

(c)  Decreasing block structure - price per unit decreases as amount used increases

.

.

.

.

.

.

.

.

.

.

  • U.S. - 32 percent uniform, 28 percent decreasing, 40 percent increasing

  • International - 49 percent increasing, 47 percent uniform, 4 percent decreasing

  • Increasing block structure encourages conservation

  • Rising water rates disproportionately affects low income households

.

5.  Water markets

  • Difference between value and price

  • Water should go to high value uses

.

a.  Water rights

  • Riparian water rights - water rights based on adjacent land ownership

  • Prior appropriation water rights - water rights based on established beneficial uses (use of water for productive purposes)

.

.

.

.

.

.

- Not economically efficient

- Discourages conservation - if not used, allocation could be reduced

.

b.  Privatization

  • Promoted by World Bank and International Monetary Fund (IMF)

- Private companies supposed to be more efficient

- Could lead to price increases, overuse

  • Opposition has led to re-municipalization of water provision

- Manage water as a common property resource

.

  • Water is both a private and a public good

  • Need to consider ecological cycles, economic efficiency, and social functions of water

.