B. Descriptive Statistics
1. Measures of central
tendency
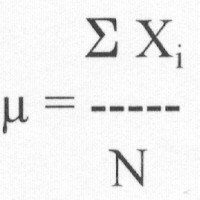
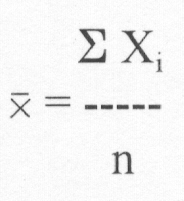
a. Mean
(arithmetic mean)
Population:

Sample:

Ex. - Yen / $
AVERAGE
function in Excel: =AVERAGE(data
range)
.
.
b. Median
Value where
half of observations are above, half below
(1) Odd number
of observations
Use middle
value
Ex.
- Yen / $
MEDIAN
function in Excel: =MEDIAN(data
range)
.
.
(2) Even
number of observations
Use
average of the middle pair
Ex.
- Yen / $
.
.
c. Mode
Value that
occurs most frequently
Ex. - Yen / $
MODE function
in Excel: =MODE(data range)
.
.
d. Geometric mean
Measures rate
of change of a variable over time
(1) nth
root of the product of n values
XG
= (X1 * X2 * . . .
* Xn) 1/n
(2) Geometric
mean rate of return
RG
= [(1 + R1) * (1 + R2)
* . . . * (1 + Rn)] 1/n
- 1
Ex. -
.
.
.
2. Measures of
variation
.
.
.
.
.
.
a. Range
Maximum -
minimum
Ex. - Yen / $
Take
difference of MIN and MAX functions of Excel:
=MAX(data range) - =MIN(data
range)
.
.
b. Interquartile
range
(1)
Definitions
First
quartile (Q1) = 25% of observations
smaller, 75% larger
Second
Quartile (Q2) = 50% of observations
smaller, 50% larger
Third
quartile (Q3) = 75% of observations
smaller, 25% larger
(2)
Calculation
Q1 = (n +
1) / 4 th ordered observation
Q2 =
2*(n+1) / 4 th ordered observation
Q3 =
3*(n+1) / 4 th ordered observation
Ex.
- Yen / $
.
.
.
.
IQR = Q3 -
Q1
Ex.
- Yen / $
.
.
c. Variance and
standard deviation
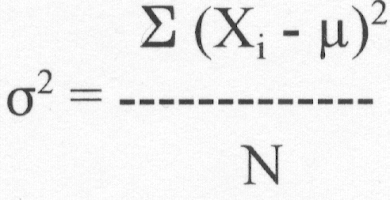
(1) Population

Ex.
- Yen / $
Population
variance in Excel: =VARP(data
range)
.
.
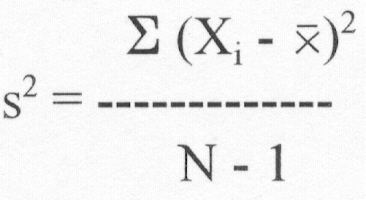
(2) Sample

Ex.
- Yen / $
Sample
variance in Excel: =VAR(data
range)
.
.
(3) Standard
deviation
.
.
Ex.
- Yen / $
Population
standard deviation in Excel: =STDEVP(data
range)
Sample
standard deviation in Excel: =STDEV(data
range)
.
.
Mutual Fund Risk Measures
All measures
given in the Descriptive Statistics function
of Excel: Tools | Data Analysis |
Descriptive Statistics
.
.
d. Coefficient of
variation (CV)
CV = (S / X) * 100%
Used to
compare variation when data measured in
different units or vary significantly in
magnitude
Ex. - Stock
prices
.
.
.
.
3. Shape
a.
Characterization
(1) Symmetric
or zero-skewness
.
.
.
.
.
(2)
Right-skewed or positive skewness
.
.
.
.
.
(3)
Left-skewed or negative skewness
.
.
.
.
.
b. Evaluation
(1) Mean vs.
median
- Mean =
median => symmetric
- Mean >
median => right skewness
- Mean <
median => left skewness
Ex.
- Yen / $
.
.
.
.
(2) Five
number summary
Minimum,
Q1, median, Q3, maximum
(a)
Evaluation
i.
Symmetric
- MInimum
-> median = median ->
maximum
- Minimum
-> Q1 = Q3 -> maximum
ii.
Right-skewed
- Median
-> maximum > minimum
-> median
- Q3
-> maximum > minimum
-> Q1
iii.
Left-skewed
- Minimum
-> median > median
-> maximum
- Q3
-> maximum < minimum
-> Q1
Ex.
- Yen / $
.
.
.
.
(b) Box-and-whisker
plot - plot of the five-number
summary
.
.
.
.
.
.
.
.
.
.
.
.
4. Ethical issues
- Good and bad
results should be documented
- Results should be
presented in an objective manner
- Need to choose
appropriate summary measures
|


