|
I. Introduction and Probability
A. Introduction to Statistics
1. Definitions
a. Descriptive
statistics - describes the characteristics of
a set of data
b. Inferential
statistics - estimate characteristics of a
population based on sample results
c. Population
- totality of items under consideration
d. Sample -
subset of population selected for analysis
e. Parameter
- summary measure that describes a characteristic
of a population
f. Statistic
- summary measure that describes a characteristic
of a sample from a population
.
2. Data
a. Variable types
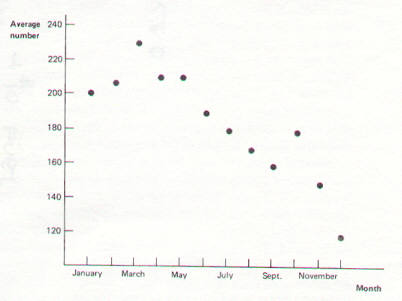
(1) Time-series
- hold unit constant, vary across time
.
(2) Cross-section
- hold time constant, vary across units
.
(3) Categorical
data - categories
.
(4) Numerical
data - numeric results
.
(a) Discrete
data - results from a counting
process
.
(a) Continuous
data - results from a measuring
process
.
b. Measurement scales
(1) Nominal scale -
no ranking of categories
.
(2) Ordinal scale -
ranking of categories is implied
.
(3) Interval scale -
no true zero point
.
(4) Ratio scale -
involves a true zero point
.
c. Data sources
(1) Primary source -
collect own data
.
(2) Secondary source -
data collected by someone else
.
-
Data distributed by individuals or organizations,
experiments, surveys, observational studies, collected by business
activities
.
d. Data cleaning and recoding
(1) Outliers -
values vastly different from most of the other values
.
(2) Missing values - advanced software can deal
with missing values
.
(3) Recoded variables - use original variables
to create other variables
.
3. Sampling
a. Concepts
(1) Frame
- list of all items from which sample will be
drawn
.
(2)
Replacement
- Sampling
with replacement - observation
returned to frame
- Sampling
without replacement - observation
not returned to frame
.
(3) Types of
samples
(a) Probability
sample - sample chosen on basis
of known probabilities
.
(b) Nonprobability
sample - probability of sample
being chosen unknown
i) Convenience sample
- select items that are easy, inexpensive, and/or convenient
.
ii) Judgment sample
- collect opinions of experts
.
..
(4) Randomness
- Random
number table - Table E.1, p. 692 - 693
.
.
Excel
function: =RANDBETWEEN(#1,#2)
.
.
.
b. Sampling
methods
- Used when dealing with probability
samples
.
(1) Simple
random sample - each item equally likely
to be chosen, use random numbers
.
(2) Systematic
sample - choose every kth item from a
list
- Easier to
do if data already in the form of a list
- Also
easier if one item produced at a time
.
(3) Stratified
sample - divide into categories, random
sample from each category
- Want
sample to match characteristics of
population
.
(4) Cluster
sample
- Divide
population into clusters
- Choose
clusters at random
- Random
sample from each cluster
- Should be
homogeneous across clusters,
heterogeneous within clusters
- Less
costly if observations scattered
geographically
.
c. Sources of error
(1)
Coverage error - exclude part of population
Ex. -
Literary
Digest
.
(2) Nonresponse
error - some people don’t respond
Ex. -
Call screening
- Upper and
lower classes less likely to respond
.
(3) Sampling
error - wrong individuals chosen by chance
.
(4) Measurement
error
(a) Question
wording - ambiguous or leading
Ex.
- Unemployment rate
Microsoft Rigged the Survey?
.
(b)
Interviewer’s effect on respondent - try
to please interviewer
Ex.
- Race
.
(c) Effort
made by respondent - exaggeration, lack of
effort
Ex.
- TV ratings, consumer surveys
.
- Key ethical issue
is intent - okay if errors made
unintentionally, unethical if deliberately done
..
4. Descriptive Statistics
a. Measures of central
tendency
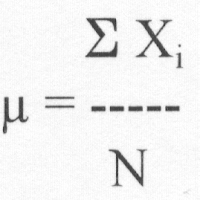
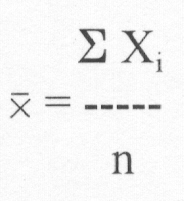
(1) Mean
(arithmetic mean)
(a) Population:
(b) Sample:
Ex. -
Yen / $
AVERAGE
function in Excel: =AVERAGE(data
range)
.
.
(2) Median
- Value where
half of observations are above, half below
Ex.
- Yen / $
MEDIAN
function in Excel: =MEDIAN(data
range)
.
.
b. Measures of
variation
.
.
.
.
.
.
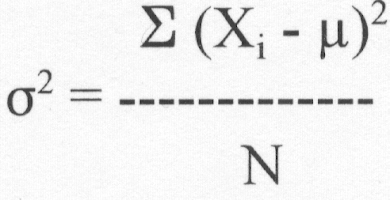
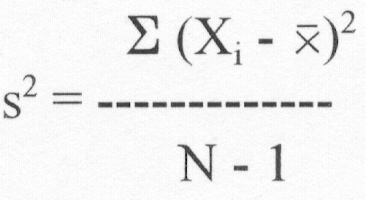
- Variance and
standard deviation
(1) Population
Ex.
- Yen / $
Population
variance in Excel: =VARP(data
range)
.
.
(2) Sample
Ex.
- Yen / $
Sample
variance in Excel: =VAR(data
range)
.
.
(3) Standard
deviation
.
.
Ex.
- Yen / $
Population
standard deviation in Excel: =STDEVP(data
range)
Sample
standard deviation in Excel: =STDEV(data
range)
.
.
- All measures
given in the Descriptive Statistics function
of Excel: Data | Data Analysis |
Descriptive Statistics
|
