
  |
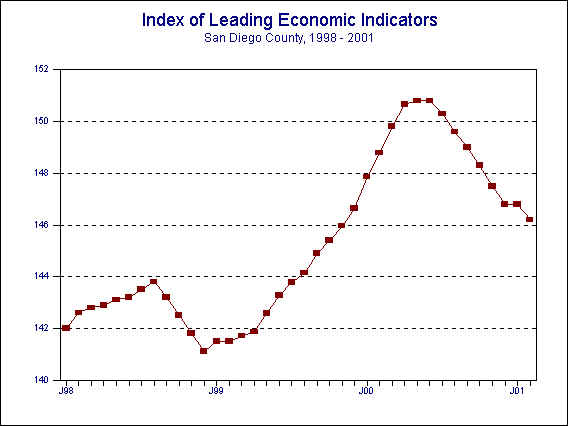
| May 17, 2001 -- The University of San Diego's Index of Leading Economic Indicators for San Diego County fell 1.2 percent in March. All six of the components in the Index were down during the month, with the biggest damage being done by big drops in consumer confidence and local stock prices. The other components--building permits, initial claims for unemployment insurance, help wanted advertising, and the outlook for the national economy–declined by smaller amounts. |
|
 |
Index of Leading Economic
Indicators The index for San Diego County that includes the components listed below (March) Source: University of San Diego |
- 1.2 % |
 |
Building Permits
Residential units authorized by building permits in San Diego County (March) Source: Construction Industry Research Board |
- 0.47% |
 |
Unemployment Insurance
Initial claims for unemployment insurance in San Diego County, inverted (March) Source: Employment Development Department |
- 0.69% |
 |
Stock Prices San Diego Stock Exchange Index (March) Source: San Diego Daily Transcript |
- 1.97% |
 |
Consumer Confidence
An index of consumer confidence in San Diego County (March) Source: San Diego Union-Tribune |
- 2.78% |
 |
Help Wanted Advertising
An index of help wanted advertising in the San Diego Union-Tribune (March) Source: Greater San Diego Chamber of Commerce |
- 0.51% |
 |
National Economy
Index of Leading Economic Indicators (March) Source: The Conference Board |
- 0.50% |
With the decline in March, the USD Index of Leading Economic Indicators has now fallen or remained unchanged for ten consecutive months. The drop of 1.2 percent in March was the largest one month decline in the Index since January 1990. All six of the components were negative, a situation that last occurred in August of last year. However, the depth of the decline was more severe in March than during last August, leading the Index to fall by more than twice as much. The outlook for the local economy continues to be for some difficulty in the second half of 2001. That difficulty is expected to be manifested in a higher unemployment rate xpected to peak between 3.5 and 4.0%) and weaker housing and retail sales. Key factors to watch in terms of their impact on the local economy are the health of the national economy and the impact of the energy crisis (both gasoline and electricity) during the summer months.
Highlights: After registering strong gains on a year-to-year basis in January and February, residential units authorized by building permits slumped in March. Building permits were down 2.65% for the first quarter of 2001 compared to the same period in 2000. . . Initial claims for unemployment insurance rose for the first time in six months in March, which is a negative for the Index. The 14,541 claims filed during the month was the highest monthly total in two years. . . The other labor market component, help wanted advertising, also fell during the month. However, the labor market remains strong, with the county unemployment rate still below 3% at 2.7% for April. . . Local stock prices have now fallen for ten months in a row. . . On a seasonally adjusted basis, consumer confidence has fallen over 25% from its high reached in September 1999. . . Despite the continued fall of the national Index of Leading Economic Indicators, the longest economic expansion in U.S. history continued in the first quarter of 2001, with Gross Domestic Product expanding at a 2% annual rate. The five interest rate cuts by the Federal Reserve, including another 0.5% on May 15, may have forestalled a downturn that many economists had expected in the first quarter. The cuts are also reduce the length and severity of any decline in the national economy that does occur.
March's decrease puts the Index of Leading Economic Indicators for San Diego County at 144.6, down from February’s reading of 146.8. There was a downward revision in building permits for February, but this did not affect the previously reported change of -0.4% for the month. The fluctuations of the Index of Leading Economic Indicators for San Diego County for the last year are given below:
| Index | % Change | ||
| 2000 | MAR | 149.8 | +0.7% |
| APR | 150.7 | +0.6% | |
| MAY | 150.8 | +0.1% | |
| JUN | 150.8 | +0.0% | |
| JUL | 150.3 | -0.3% | |
| AUG | 149.6 | -0.5% | |
| SEP | 149.0 | -0.4% | |
| OCT | 148.3 | -0.5% | |
| NOV | 147.5 | -0.6% | |
| DEC | 146.8 | -0.4% | |
| 2001 | JAN | 146.8 | +0.0% |
| FEB | 146.2 | -0.4% | |

For more information on the University of San Diego's Index of Leading Economic Indicators, please contact:
| Professor Alan Gin
School of Business Administration University of San Diego 5998 Alcalá Park San Diego, CA 92110 |
TEL: (619) 260-4883 FAX: (619) 501-2954 E-mail: agin@home.com |