Physics 272 Laboratory Experiments
Dr. Greg Severn
Spring 2016
4 Atomic Emission Spectroscopy
4.1 Introduction:
The purpose of this experiment is to investigate the
spectrum of light emitted by various atoms prepared in gas discharge sources.
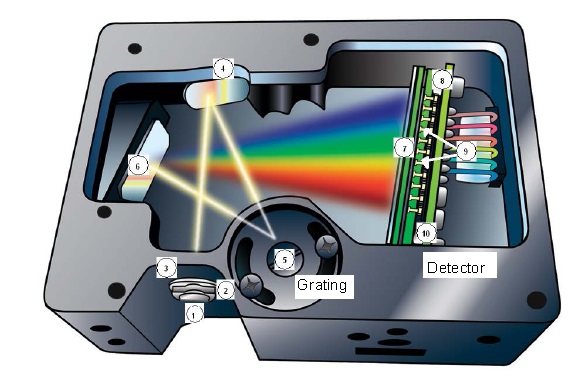
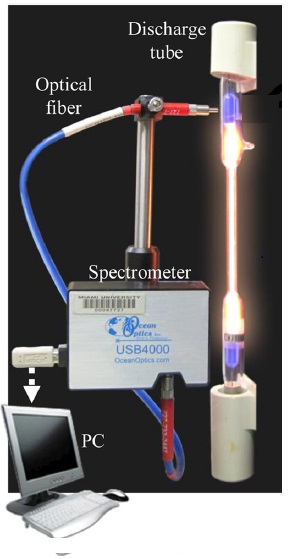
This can be done using an integrated diffraction grating and CCD detector (Ocean Optics USB 4000)
Light from the emitting object is collimated by a fibre optic cable with which the light is directed via mirrors to reflective grating, and from
there to a CCD detector. The detector is calibrated to readout intensity vs. wavelength.
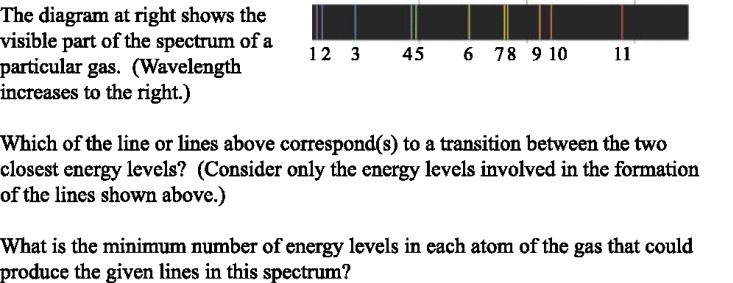
 A series of colored bands of light is observed, indicating that the
glow coming from the light source is not a continuous distribution
of wavelengths, but rather a discrete spectrum of colors. It is the
interference effect that disperses light of differing wavelengths
through different angles. Atomic spectra for a few common elements
are shown below.
A series of colored bands of light is observed, indicating that the
glow coming from the light source is not a continuous distribution
of wavelengths, but rather a discrete spectrum of colors. It is the
interference effect that disperses light of differing wavelengths
through different angles. Atomic spectra for a few common elements
are shown below.
4.2 Experimental Problem to solve:
Various gas discharge sources are available. Determine the
characteristic of spectrum of 4 of these, including that of hydrogen and sodium. How precisely can you
determine the wavelengths in first order (i.e. in the first order spectrum)? What is the uncertainty of the measurement? Slightly more interesting is this: will this
uncertainty permit the resolution of the sodium doublet, D1 and D2, that is,
will you be able to see those two lines as two distinct lines?
A part of every experiment is doing the hard work of understanding how the experiment `works'. This involves knowing what the experiment is about, what physics issues
are at stake in the experimental test, and how the experiment is contrived (with apparatus on the one hand, and with a theoretical model on the other) to illustrate or bring out
those issues so that the doubtful point can become clear. Be ready to answer the question (how does the experiment work?) during various stages of the actual doing of the experiment, and of course, try to have an answer for this when you first enter the lab. Since `resolving power' is such an issue, a central one in the science of
spectroscopy, I will include some notes on spectroscopy itself at the end. Bear in mind, that spectroscopy is for us simply an experimental technique. The deeper physics issues have to do with a model of nature that can account for the phenomena captured or observed using spectroscopic techniques. I think you will enjoy playing with a simulation of a gas discharge after you have completed the experiment (and before you write your report:).
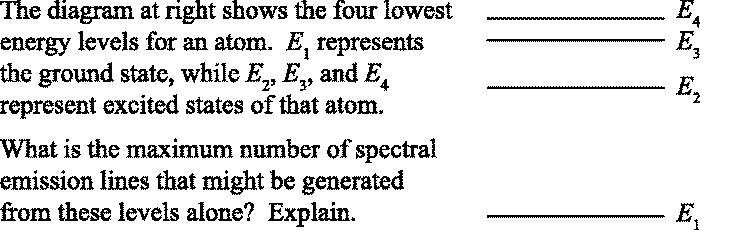
Since we have not yet reached the chapters in Moore's text treating atoms and molecules, a quote
from Dirac's monograph on Quantum Mechanics might help, especially with questions 6 and 7.
The necessity for a departure from classical mechanics is clearly shown by experimental results. In the first place the forces known in classical electrodynamics are inadequate for the explanation of the remarkable stability of atoms and molecules, which is necessary in order that materials may have any definite physical and chemical properties at all. The introduction of new hypothetical forces will not save the situation, since there exist general principles of classical mechanics, holding for all kinds of forces, leading to results in direct disagreement with observation. For example, if an atomic system has its equilibrium disturbed in any way and is then left alone, it will be set in oscillation and the oscillations will get impressed on the surrounding electromagnetic field, so that their frequencies may be observed with a spectroscope. Now whatever the laws of force governing the equilibrium, one would expect to be able to include the various frequencies in a scheme comprising certain fundamental frequencies and their harmonics. This is not observed to be the case. Instead, there is observed a new and unexpected connexion between the frequencies, called Ritz's Combination Law of Spectroscopy, according to which all the frequencies can be expressed as differences between certain terms, the number of terms being much less than the number of frequencies. This law is quite unintelligible from the classical standpoint.
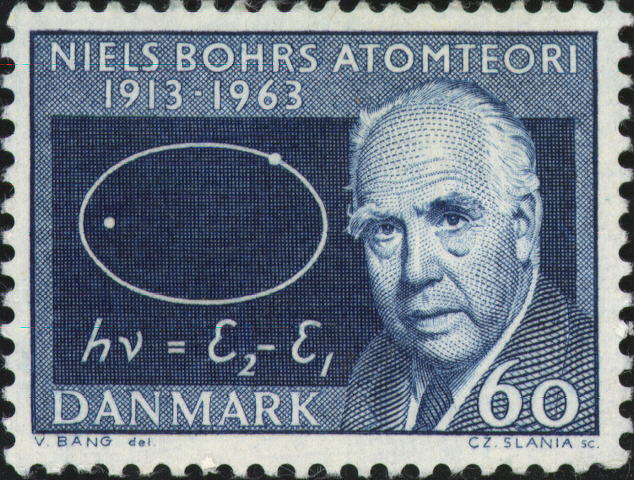
By terms, the spectroscopy community eventually meant 'energy levels'. How they 'work' is actually pretty well, and pretty simply expressed by Dirac. How the frequencies are decrypted from the 'difference between ... terms' is found concisely expressed above on the stamp with Bohr's picture.
4.3 Procedure:
Observe the following precautions and do the following things:
- The fibre optic cable can collect enough light to saturate the detector. Consult the instructor regarding the software controls that will permit desensitizing the detector. Information about this can be found in the OceanView manual which, one hopes, will be on our website by the time of the lab!
- The spectral lamps emits a considerable amount of
radiation in the ultraviolet region. This can cause severe
eye damage. Do not stare at the bulbs except through the spectrometer. Avoid
doing more than glancing at them otherwise.
- The potential across the discharge tubes is about 5000
volts. Do not touch the discharge apparatus when the power
is on.
- For a given source of radiation, list the source and find the peaks. Record these in your lab notebook. Record your estimate of the experimental uncertainty.
- Repeat this for the other sources.
- Try to resolve the Na doublet near 589nm. At this
wavelength, there are two very close lines which differ by only
about 0.5 nm. See if you can resolve them. Make a sketch of the data.
Certainly this sketch should go in your lab notebook. Should it go in the second section of the lab report? Well, that depends on your
abstract!
4.4 Questions:
- Complete a table of observed lines and calculated wavelengths, including columns for discrepancy and uncertainty. This isn't really
a question to complete in the third section of the report so much as the indication of what should go in the `graphs
and tables' section of the report. Make sure there is a table caption and that the columns have titles (with units!).
Compare these observations with known spectral lines for the atom or
molecule in question. Spectral lines for the elements can be found
in many places, including the NIST website,
http://physics.nist.gov/cgi-bin/AtData/main_asd
Does your uncertainty explain or account for the
discrepancy? What is the principle source of uncertainty do you
think?
- Why is it that one can see all the different colors at once?
Is this what one would observe if one observed a single, isolated
atom? Explain.
- Explain in your own words what gives rise to spectral lines,
from a quantum mechanical point of view.
- For the light sources used in these experiments, would the
absorption spectra of the element in question have the same lines as
the observed emission spectra? Explain.
- Answer this question even if you couldn't resolve the doublet
in Na. What resolving power is necessary to resolve the famous Na
doublet? Get the precise numbers from the NIST website. What
resolving power does the spectrometer have in 2nd order?
Finally, what causes the Na doublet? Sure, there are two close lying
energy
states which allow transitions to the same lower energy level, but
what causes the energy separation in the two close lying states? What
story about Quantum Mechanics is told by the doublet?
-
-
4.5 Notes on spectroscopy and diffraction gratings:
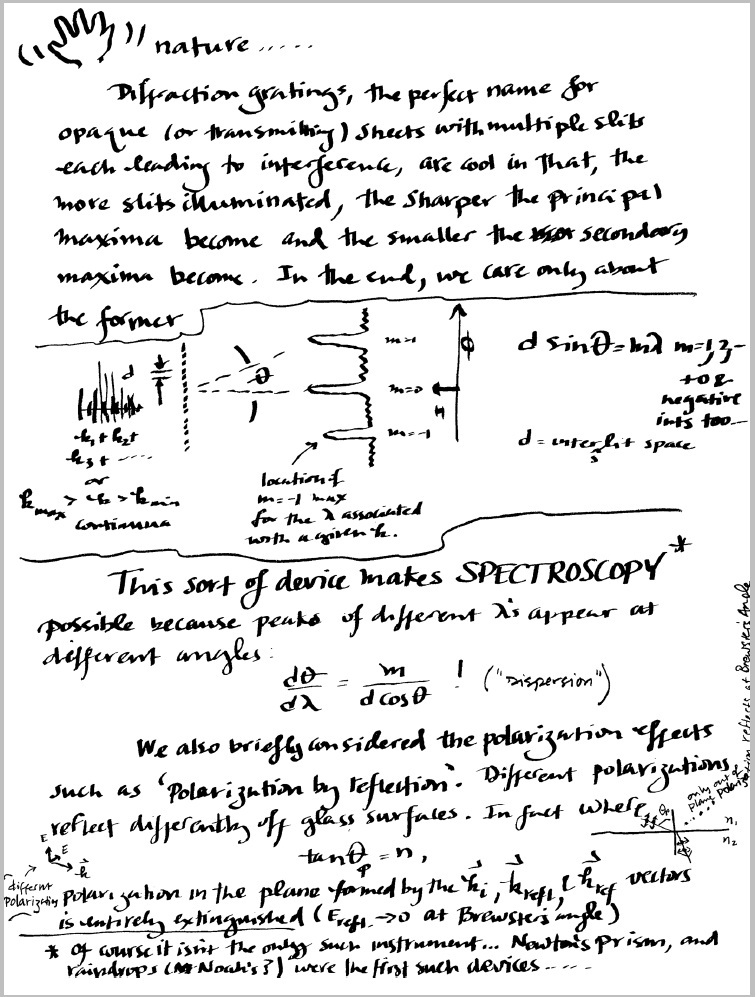 The resolving power of a grating, R, may be written as
where m is the `order' of the interference maxima or `spectra', and, this is really important, N
is the number of slits illuminated by the light that is being analyzed. A a nice reference for the idea can be found
at the hyperphysics site.
This site permits some playing
around with the concept (useful to do before lab!).
File translated from
TEX
by
TTH,
version 4.64.
Spring 2016