In this lab we'll use the Ocean Optics USB400 and Flame, to take a closer look at the spectrum of H I and Na I [1].
Our research questions are these:
How do wavelengths of spectral lines depend on Planck's constant, and is it possible to use the wavelengths of a family of spectral lines (to be defined presently) to infer a value for Planck's constant? How precise (how many significant digits) a measurement can we make with the method outlined in task #1?
How does the difference in wavelengths between the so-called D lines of the 'Sodium doublet' depend on internal magnetic fields within atom itself, and how big is that magnetic field? Estimate the magnitude of this magnetic field directly from spectroscopic data. Let's say that the energy gap between the two 3-p states of Na I can be attributed to an effective magnetic field generated by the orbital angular momentum of the electron said to be in that state (use of language here is critical). why should that effective magnetic field create an energy gap in the first place, and how precisely can we measure this effective magnetic field strength? What limits the precision of the measurement of the magnetic field outlined in task #2?
Bohr's model of the atom (1913, see Moore, Q10.4) furnished a quantum-theoretical
answer to a long standing riddle of the line spectrum of Hydrogen, which had been modeled empirically [2,3], and let's call it the Rydberg model, but without any known physical model to justify it:
\begin{equation} 1/\lambda_{nm} = R_H \left ( 1/m^2 - 1/n^2
\right ).\label{eq:rydberg} \end{equation}
The values $m$ and $n$ are integers, and the empirically constant $R_H$, the so-called Rydberg constant [4], was known (measured!) to be $ R_H = 1.0 973 731 \times 10^7 m^{-1}$. Bohr's work (while a post-doc for Rutherford at the Cavendish!) laid the foundation for modern non-relativistic quantum mechanics (NRQM), the subject of Moore's entire book Q. Bohr contributed a bold model that furnished a physical theory leading to precise prediction that 'explained' the Rydberg model (Eq. (1)) and expressed the empirical Rydberg constant in terms of known physical constants, \begin{equation}
R_H = \frac{m_e e^4}{8 \epsilon_o^2 h^3 c},\end{equation}
where $m_{\text{e}}$ is the rest mass of the electron,
$ {\displaystyle e} $ is the elementary charge,
$ \varepsilon _{0}$ is the permittivity of free space, $c$ is the speed of light in vacuum, and
$h$ of course is the Planck constant. A good measurement of the Rydberg constant from our data permits, with quantum mechanics, an unfolding of the value of Planck's constant. This measurement of Planck's constant accounts for half of the lab deliverables. The other half? That's about spin, and the internal terrifically huge magnetic fields inside of atoms.
6.2 Task #1: obtain an estimate of $h$, Planck's constant, from the spectrum of Hydrogen
Measure (acquire) the emission spectrum of H I
using the USB4000 or FLAME spectrometer using OceanView in the usual fashion. Just to review what `that fashion' is, it involves recording in detail the sequence of software commands and settings necessary to obtain and save the data, recording of course the full path names of all files created, with a brief note of what the files contain. The Ocean-view software manual is found on the public course website.
Here follow some safety and best-practice notes:
Various gas discharge sources are available. Acquiring the spectrum is easy, and can be done using the integrated diffraction grating and CCD detector
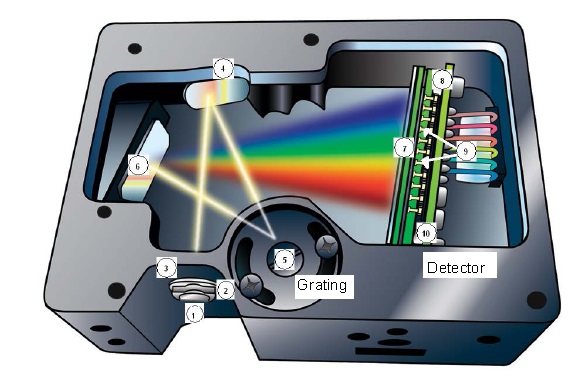
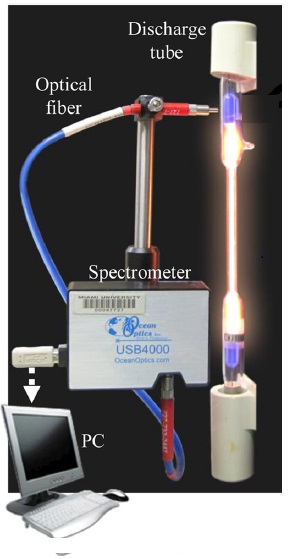
(Ocean Optics USB 4000, and USB Flame). Note, though, that the CCD detector has a very bad efficiency for long wavelengths! This leads to the long wavelength cutoff for the spectrometer. The The whole integrated miniaturized contraption is pictured in figure 1.
Light from the discharge lamp is collected by a fiber optic cable and directed via mirrors to reflective grating, and from
there to the CCD detector, a quantum light detector that makes use of the photoelectric effect.
The detector is `calibrated' to readout intensity vs. wavelength. Before collecting the spectra, remember the following precautions:
The fiber optic cable can collect enough light to saturate the detector. Consult the manual regarding the software controls that will permit desensitizing the detector. Information about this can be found in the OceanView manual (see lab course website).
The spectral lamps emits a considerable amount of
radiation in the ultraviolet region. This can cause severe
eye damage. Do not stare at the bulbs. Avoid
doing more than glancing at them otherwise. Turn them on only when acquiring a spectrum, then turn them off. This increases the lifetime of the tube.
The potential across the discharge tubes is about 5000
volts. Do not touch the discharge apparatus when the power
is on.
The lamps should not be kept on continually--only when taking data. Just after you turn them off, they will still be hot to the touch, avoid getting burned. Let them cool off before handling them.
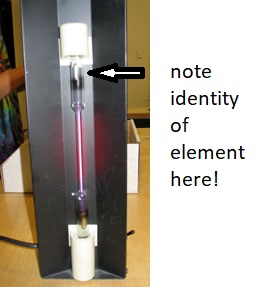
Record the name of the element by reading the label on the tube, not the label on the black discharge tube housing and power supply. Making sure that tube is not energized, and that the tube is cool enough, turn the label face forward if you need to read the label. In kindness to the next user, leave the tube face forward, and only after that, energize the tube to begin taking data.
Figure 1. On the left, a look into our modular spectrometer, showing its principal parts, and on the right, the basic setup with the plasma discharge lamp, fiber optics for light collection, and so forth. Note: the sodium lamp is much older than the equipment pictured here, however, the means of acquiring the spectrum is the same.
So, obtain the entire Balmer series, or as much of it as you can, which could mean doing it in pieces and sensitizing or desensitizing the vertical scale as needed. The familiar energy level diagram that appears in Moore's, `Partial Grotrian Diagrams of Interest' [5] enumerates the lines we'll try to record, below. Obtain the wavelengths for $H_{\alpha}, \: H_{\beta}, ..., H_{\epsilon}$. The ones in the UV of course are the hardest to get. The spectrometer has a short wavelength cutoff at effectively 350 nm. Huh. Given Eq. Q10.16 in Moore, $E_n = -(13.6 eV)/n^2$,
or, from Eq. (3) and Eq. (4) above, calculate what should be the shortest wavelength in the Balmer series. Can the spectrometer ''see it''? The intensity of spectral lines diminish with wavelength, however this is mostly due to diminished grating reflection efficiency, along with the nonuniform absorption efficiency of the CCD.
Figure 1. A common depiction of the energy levels of the Hydrogen atom, from Charlotte Moore's, ''Partial Grotrian Diagrams of Astrophysical Interest''.
Schrodinger's equation was experimentally benchmarked by the spectrum of the Hydrogen atom. All great advances in quantum theory (including QED, and QFT) earned credibility by getting things right about the Hydrogen atom. The first quantum model to do so was Bohr's. We will have reason to pursue his model in class very soon. For now let's observe that the Bohr model correctly finds that the discrete energy levels in the Hydrogen atom (without worrying about the so-called fine structure) of the energy eigenstates are given by
\begin{equation}
E_n = - \frac{\mu_e k^2 e^4}{2 \hbar^2} \frac{1}{n^2}, \label{eq:snp}\end{equation}
where $e$ refers to the electron, $\mu_e$ its 'reduced mass' mass (that one needs the 'reduced mass' is treated here)
and $|e|$, its charge, $k=8.988 \times 10^{9} N\cdot m^2/C^2$, the electrostatic force constant, and $n$ is an integer, Bohr's so-called principal quantum number. Planck's constant (expressed with the short hand `bar' indicating division by $2\pi$) you already know. From this and
Bohr's rule for determining the energy of the emitted photon when the atom transitions between energy eigenstates,
\begin{equation} E_n - E_m = hf = \frac{hc}{\lambda}_{nm}, \label{eq:bohr} \end{equation}
find a theoretical expression for the Rydberg constant $R_H$ in terms of physical constants, that is, use Eq. (3) and (4) to get Eq. (1). Now we a theoretical estimate of the empirical Rydberg const. Look up all the constants and and calculate $R_H$ and compare with a) the known value of $R_H$. This is a theoretical version of the 'predict, test, compare' loop that motivates much of experimental work. Anyway, now we have a theoretical model for $R_H$.
What about an experimental value for $R_H$? Consider how one might plot some function of the wavelength vs. some function of Bohr's principal quantum numbers such that the Rydberg constant is the slope of the model curve. Think up such a model, describe it physically and mathematically. What function of the wavelength must be plotted on the ordinate? What must be plotted on abscissa? Explain your reasoning.
Make a table from the measured spectra with 3 columns for use on Fitteia website, with the $x$, $y$, and $\Delta y$ values. What are these? What are to be column headings and descriptors? What uncertainty is assigned (calculated) for the $y$ values? What is the uncertainty for the $x$ values? Explain. Estimate and calculate these, and be very clear about them.
Now that you have a physical model, write down a mathematical model that will permit fitting the model using Fitteia. Find the best fit value of the Rydberg Constant constrained by actual measured data. Save the modeling page created thereby (and write down the filename you've created). In Goldilock's style, find the uncertainty in $R_H$. Almost done. As a check on progress, compare the best value for $R_H$ with theoretical value. Explicitly compare them (i.e. calculate the answer to the question: is the discrepancy less than the uncertainty?)
From the experimental best value of $R_H$, arrive at an experimental best value for $h$ and propagate its uncertainty. How many significant digits can you be sure of using this approach? Explicitly compare it with the accepted value.
Ok, now almost done. One last thing! Write down a complete procedure, complete with sketches of instruments, all the settings needed, to get the data you've just gotten!
6.3 Task #2: measure the magnetic field strength inside
the Na I atom
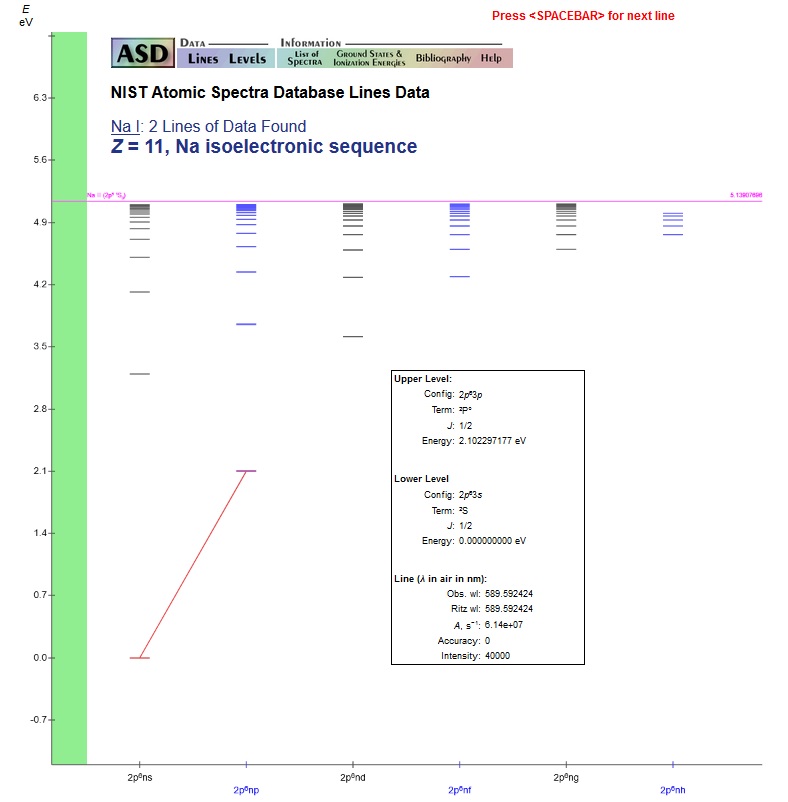
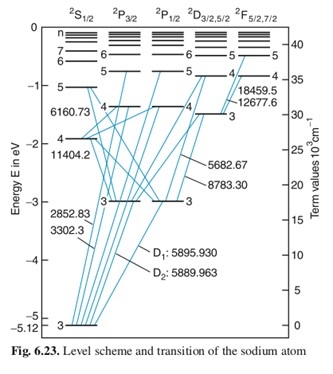
Here's a partial Grotrian diagram for Na I from the NIST lines database, that we learned to use in Lab #5. Note the 'p' states one column over from the left. It looks as though there is just one state around 2.1 eV above the ground state, and one spectral line connecting that state to the ground state (remember Dirac's explanation of spectral lines from Lab #5). What we can't see at this level of magnification, but which is hinted at all the same in the header, is that there are really 2 really, really close spectral lines, each from really, really close energy levels, so close that they cannot be seen as distinct on the diagram, which would have to magnified many many times bigger to them as separate. This is an example of what is called 'fine structure' in atomic physics, and it is indicative of some impossibly cool underlying physics! The energy gap between the two close lying energy states arises from something called the 'spin-orbit' effect. Simple, graphical explanations can be found here (for H I), here, and here). It is as if the orbital angular momentum of the electron gives rise to a magnetic field (of course it cannot be as simple as that, we are using classical language to understand what is inherently a quantum phenomena...not an easy task!), and since the electron also has 'spin', well, space quantization leads to energy quantization that splits the energy level in two, as will be discussed in more detail below. For historical reasons, the two close lying spectral lines, right at the edge of resolvability with our equipment, are called 'D' lines. Because there are 2 of them, they are called a doublet. They are as well knowns as the Balmer series discussed above.
Figure 2. A partial Grotrian diagram of Na I From the NIST Lines Database. Included also is a enlarged partial Grotrian diagram showing the Sodium Doublet (the D-lines)
from the book Atoms, Molecules, and Photons, Demtroder, Springer-Verlag 2nd Ed.
Our goal in task #2 is to estimate this magnetic field strength by calculating the energy difference between the two
terms that give rise to the famous Sodium Doublet (the yellow lines
at 589.5 and 589.0 nm, or thereabout), that are split apart because of the spin of the electron. The neutral Sodium atom (Na I), just as with the Silver atom (Ag I), has a single electron in atop its highest energy level; all the lower energy levels are filled, and 'closed', in the sense that sum of the their angular momenta is zero. The net angular momentum of the entire atom comes from its outer most electron which has a non-classical two-valuedness associated with it, which in this case is $\pm \hbar/2$. Pauli first, and others later taught us to recognize as spin, the intrinsic angular momentum of the electron itself. And so the electron becomes recognized as nature's tiniest quantum magnet. Theory says that the energy that a magnetic moment has in a magnetic field is just \begin{equation}
E =- {\boldsymbol \mu} \cdot {\boldsymbol B_{eff}}, \end{equation} where of course the magnetic moment is related to the intrinsic mechanical angular momentum, or spin, of the electron, and we may write \begin{equation} {\boldsymbol \mu} = - g_s \left\{ \frac{e\hbar}{2m_e} \right\} \frac{{\boldsymbol S}}{\hbar} = -g_s\frac{\mu_B}{\hbar} {\boldsymbol S} = \gamma {\boldsymbol S}.\end{equation} And $g_s$ is
called the g-factor of the electron, which is 2, and the minus sign comes because of the negative charge (still a little confusing, I know; read $e$ here as $|e|$). The g-factor (dimensionless), the Bohr magneton (from the constants in the curly brackets, $5.796 \times 10^{-5} eV/ T$), and Planck's constant give us $\gamma$, the gyromagnetic ratio, which is the very important conversion factor between a particle's magnetic moment and its angular momentum, in this case, its spin angular momentum. The gyromagnetic ratio is not dimensionless, but rather has units of magnetic moment per angular momentum, and yes, Planck's constant has units of angular momentum. You'll meet the gyromagnetic ratio in future classes that treat nuclear magnetic resonance (NMR), and then the spin angular momentum will have to do with nuclear spin angular momenta! Our Physics program has a few such classes, as does Chemistry's. The 'resonance' in NMR is simply the recognition that there is a photon whose energy is precisely equal to the energy gap between the 'spin up' (read, $+\hbar/2$) and 'spin down' ($-\hbar/2$) states, separated by an externally applied effective magnetic field. And the frequency of that photon is often in the radio frequency range, MHz to GHz.
The effective magnetic field within the Sodium atom (Eq.(5)) arises from the orbital angular momentum of the electron. Heuristically, we expect an effective circulating current to create this magnetic field. So we might not expect the same splitting to be found in the so-called S states (recall the partial Grotrian diagrams of H I and Na I had columns of S, P, and D states, etc. having to do with orbital angular momenta). This duplicity in the use of the letter S here can be confusing, so I thought I'd face the issue rather than not address it at all. Here S means 'Sharp', P means 'Principal' and so forth, all words assigned to spectral line patterns long before NRQM was invented. In any case, the effective orbital angular momentum (true of P states, for example) constitutes an effective current circulating the nucleus, which in turn leads to energy differences in states of different spin orientation relative to that effective magnetic field. Of course this is an extremely simplified, very classical, view. Not one any physicist thinks is real (in their saner moments). We stress the term 'effective magnetic field'. The details of this are beyond the scope of this course, and can be found in the treatment of 'fine structure' in more advanced treatments of quantum mechanics. However, in the simpler case in front of us, we can estimate the energy gap between the two doublet states, from Eq. (5) and (6) as\begin{equation}
\Delta E = +\gamma B\hbar/2 - ( - \gamma B \hbar/2) = \gamma \hbar B = g_s \mu_B B,\end{equation} where $ B = B_{eff}$. Thus, a measurement of the gap energy coupled with the known value of the gyromagnetic ratio, the `g-factor' for spin, the Bohr-magneton, and the value for $\hbar$ leads to an experimental estimate of the effective magnetic field. A brief description of the energy gap between the two close 3p energy levels, one shown with $J = 1/2$ and the other (too close to be seen on Figure 2 as different) with $J = 3/2$ is also described here at the hyperphysics site.
Obtain a spectrum of the Sodium Doublet, near 590nm. Set the width on the spectral abscissa to, say, 580 to 600 nm, and see if you can see the splitting. It's a strong line, so be sure to reduce the integration time sufficiently so that the detector doesn't saturate. Use the magnifying glass icon (the one with the numbers on it!) to change the x and y axes ranges. How well resolved is the Doublet? This is a measure of the resolution of the instrument. The required resolving power, R maybe calculated (using a version of Rayleigh's Criterion) thus:
\begin{equation}
R = |m| N,\end{equation}
where $m$ is the order of the of the interference maxima or 'spectra', and $N$
is the number of slits illuminated by the light that is being analyzed. A nice reference for the idea can be found
at the hyperphysics site.
From the mini-spectrum in the region of the Doublet, estimate the resolving power of our spectrometer. Explain how this affects your estimate of the uncertainty of the peak of a given spectral line.
Approximate how many lines of the grating are illuminated, assuming the grating is 600l/mm, and assuming the spectral order, $m$ is 1. Does your answer make sense (e.g. would it require the device to be very much larger than it is or not?). Explain.
Next, using Bohr's rule (Eq. (4)) and the known wavelengths of the two transitions that make the Doublet, do the following:
calculate
the energy
difference between the two terms from wavelengths of the spectral lines. Experimentally, what is the uncertainty of that determination of $\Delta E$, the gap energy? Do the best you can with the nomenclature here. Use significant figures appropriately.
From the equation of the energy difference of a magnetic field depending on orientation, (Eq. (5), through Eq. (7) ) obtain an estimate of the effective magnetic field strength that splits the doublet states in Na I. Compare this value with the strength
of the Earth's magnetic field and a typical laboratory magnetic field to gain some perspective. Is this a big field or a small field? Explain your reasoning.
Draw a partial
Grotrian diagram that represents these two transitions and the energy levels involved, to scale, in your lab notebooks, only the levels associated with the doublet. On your partial Grotrian diagram, label the excited state that has the electron spin in
the same direction as the magnetic field and in the opposite direction. Briefly explain
your reasoning.
The last thing to do of course is to compose an abstract as described in the 'notes on lab notebooks' page.
References:
a Roman
numeral next the symbol of the element, recall, refers to the ionization
state of the atom, so for example, I means neutral, and typically the natural state (at least
terrestrially), II means that the atom is
singly ionized, III , doubly ionized and so on.
J. Balmer, 1885, Basel Verh. vii, pp. 548, 750
J. Rydberg, 1890, Phil. Mag. xxix, p333, also in 1890, Kong. Sv. Vetnsk. Ak. Handl. xxxii, no. 11; ref.'s 2, 3 are found in E.T. Whittaker, ``A History of the theories of the Aether & Electricity, Vol. I, p.376, Dover ed. 1989.
a value often found in tables is $R_{\infty}$,
$R_{\infty}= 1.09737318 \times 10^{5}cm^{-1}$ which doesn't consider the mass of the electron 'reduced'. How is this related to $R_H$?