How well calibrated are the USB 400 Ocean Optics Spectrometers?
How are observed spectral lines related to energy level diagrams (ELD)?
The research questions for this lab are both technical and conceptual. The Ocean Optics USB modular spectrometers permit the rapid acquisition of spectra between 350 and 1000 nm for light sources. Why would an electrical discharge in a gas of some element produce atom spectra? What is a 'spectrum'? What is the underlying physics that gives rise to 'spectral lines'? For most students in PHYS272L, this lab is encountered before those chapters in the text that discuss atomic spectra. Let's just say that `spectra' serve as a unique finger print of an atom, and is used to determine atomic (molecular, etc.) composition of a sample of material from the light it emits, and that each atom has a unique set of energy eigenstates (for the electrons trapped in the attractive Coulomb potential) that encode the energy of each emitted photon. The composition of stars is inferred through spectral analysis, for example. We know that spectrometers use dispersive optical elements such as
diffraction gratings. One can use the fiber optics to obtain a spectrum of the fluorescent lamps (by far the most prevalent light source in buildings in the world), and discover the atomic constituents within the lamp. The figure figure below can be found in the Wikipedia article on the fluorescent lamp (scroll down to see the spectra). There you'll see
Figure 1. Typical fluorescent lamp spectra, and table of 'spectral lines' and wavelengths: note the figure caption indicating that the spectra were taken using the Ocean Optics USB2000. My apologies for not reproducing the references from the Wikipedia article.
They mention a calibration discrepancy! That's our first research question. What is the calibration discrepancy for ours?
The second research question has to do with the quantum theory of radiation in atoms and molecules, and an imaginary conceptual construct known as an Energy level diagram, or rather a Grotrian Diagram [1].
Since we have not yet reached the chapters in Moore's text treating spectra in atoms and molecules (but do please look at Q11 in Moore's text!), a quote
from Dirac's monograph on Quantum Mechanics [2] helps us understand how understanding spectral lines required a marked departure from classical physics:
The necessity for a departure from classical mechanics is clearly shown by experimental results. In the first place the forces known in classical electrodynamics are inadequate for the explanation of the remarkable stability of atoms and molecules, which is necessary in order that materials may have any definite physical and chemical properties at all. The introduction of new hypothetical forces will not save the situation, since there exist general principles of classical mechanics, holding for all kinds of forces, leading to results in direct disagreement with observation. For example, if an atomic system has its equilibrium disturbed in any way and is then left alone, it will be set in oscillation and the oscillations will get impressed on the surrounding electromagnetic field, so that their frequencies may be observed with a spectroscope. Now whatever the laws of force governing the equilibrium, one would expect to be able to include the various frequencies in a scheme comprising certain fundamental frequencies and their harmonics. This is not observed to be the case. Instead, there is observed a new and unexpected connection between the frequencies, called Ritz's Combination Law of Spectroscopy, according to which all the frequencies can be expressed as differences between certain terms, the number of terms being much less than the number of frequencies. This law is quite unintelligible from the classical standpoint.
By terms, the spectroscopy community eventually meant 'energy levels' characterized not solely by Bohr's principal quantum number, but by the quantum numbers associated with the angular momentum of the state, yielding what are now called 'spectroscopic terms' (e.g. $^1 S_0$ for the ground state of Helium, a 'singlet' state). The energy levels, as we found for spin states of the electron, form a discrete set of states. How the frequencies are decrypted from the 'difference between ... terms' is concisely expressed using Planck's quantum hypothesis below in equation 1. The energy difference between two stationary (eigen)states is carried off by a single light quanta which we've been calling a photon, in a spectacular confirmation of the conservation of energy, \begin{equation}
E_{ph} = \frac{hc}{\lambda_{ik}} \equiv E_i - E_k.\end{equation}
The subscripts refer to different energy terms or levels, where for emission, $E_i > E_k$, and where now the wavelength (and frequency) of the emitted photon is no longer related to the energy of any single state (as is the case classically), but two states.
This is profoundly unclassical, and truly takes some getting used to. If I may try your patience with one more paragraph, I think the impact of Bohr's model must be brought out a little more sharply. Bohr's explanation of spectral lines was more to the purpose of explaining why atoms are stable at all, something that became a great scandal in physics once the meaning of Rutherford's discovery of the nucleus had come home to physics community. His, Bohr's, adoption of Planck's quantum hypothesis seems now inevitable: how else can energy be conserved unless the light-quanta's energy be associated with a change in energy of the atom? How else can one get at the allowed eigenstates unless the light quantum accounts for the energy difference between those allowed states, and the difference between their angular momenta? However logical in hindsight Bohr's great step appears to us, we cannot ignore what 'classical physicists' felt they were being asked to give up in order to access the explanatory power of the new quantum theory. They were unsubtly being asked to give up determinism, causality. I need to quote an historian to buttress my assertion here:
Of particular interest is a letter of 20 March 1913 in which
Rutherford commented on Bohr's manuscript for the Philosophical Magazine.
Apart from some minor criticism, Rutherford complained that it was 'very
difficult to form a physical idea' of the basis of Bohr's theory, a complaint that
would soon be repeated by other British physicists. More specifically, Rutherford
referred to what he called 'one grave difficulty,' namely this: 'How does an
electron decide what frequency it is going to vibrate at when it passes from one
stationary state to the other? It seems to me that you would have to assume that
the electron knows beforehand where it is going to stop.' Rutherford instinctly [sic]
sensed the element of acausality associated with Bohr's atom, a feature which
would only move to the forefront of discussion several years later. [quoted from Helge Kragh, 'The early reception of Bohr's Atomic Theory (1913-1915)', Research
Publications on Science Studies 9. Aarhus: Centre for Science
Studies, University of Aarhus, (2010)]
Note Rutherford's implicit association of the spectral line to the 'physical' vibrations of an electron whose flight had abruptly changed. This is how one of the greatest physicists kicked and screamed at quantum jumps (others later would be more shrill). Here he wants the photon's light to be associated with deterministic, causal, classical motion. Bohr's great leap is this quantum jump whereby the electron's energy change appears as a photon, all in one go, in a jump. Rutherford is having trouble with what 'physical' even means. He, like others would after him, was having a kind of vertigo, teetering between not knowing what the word meant anymore and not being willing to altar what the word had meant before Bohr's paper. Can you see why Bohr's papers were so important? Important papers make us have to look at the world in a new way. Bohr's contribution here certainly did this. And Rutherford was quite right. It meant accepting the fundamental acausality of the process that created the photon. The best one could ever do was to calculate its probability. A war was then brewing about what the new theory meant. Against its import, against the underpinnings of the new physics, against acausality, its combatants would include Einstein, Schrodinger, and de Broglie (as ironic as that sounds), and as we have seen, Rutherford (to some extent). Later, there would be Bohm, then Bell, and now there are too many to count. They stand against Heisenberg, Born, and of course Bohr (this notion of a 'Copenhagen' Interpretation hides the other 'cities' that helped to frame the banner so named, including Göttingen, Cambridge, Moscow, and Pasadena, among others). Let me end this 'paragraph' with a final assertion of my own. I do not think that the scientific revolution visited upon humanity by the crisis that is quantum mechanics is over and done. This, our current situation in the 21st century, is what revolutionary times look like. We are living in a scientific revolution right now.
5.2 Task #1: how well calibrated are the USB spectrometers? What spectral resolution characterizes them?
Obtain a spectrum of atomic Hydrogen (H), Mercury (Hg), and Helium (He), in the 400-900nm range. Label with a lower case letter, the 4 strongest lines that you see for each spectrum! Print the plots and tape them into your lab notebooks, annotated with letters as noted. Record in detail the sequence of software commands and settings necessary to obtain and save the data, recording of course the full path names of all files created, with a brief note of what the files contain. The ocean view software manual is found on the public course website.
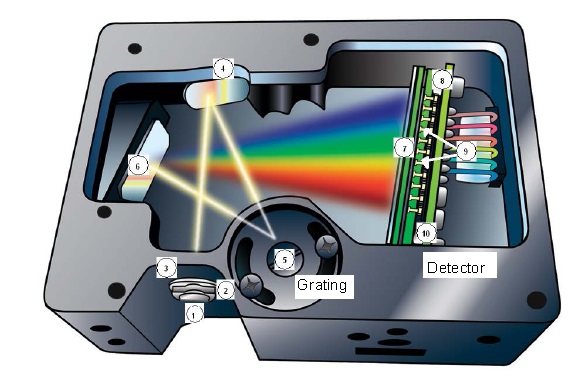
Various gas discharge sources are available. Acquiring the spectrum is easy, and can be done using the integrated diffraction grating and CCD detector
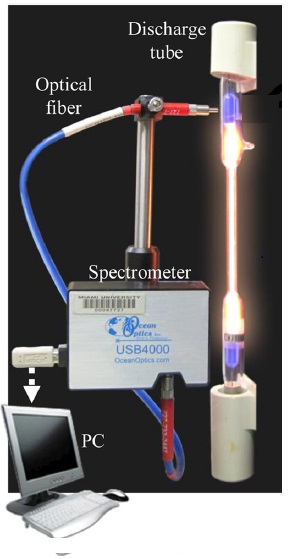
(Ocean Optics USB 4000, and USB Flame). The The whole integrated miniaturized contraption is pictured in figure 1.
Light from the discharge lamp is collected by a fiber optic cable and directed via mirrors to reflective grating, and from
there to the CCD detector, a quantum light detector that makes use of the photoelectric effect.
The detector is `calibrated' to readout intensity vs. wavelength. Before collecting the spectra, remember the following precautions:
The fiber optic cable can collect enough light to saturate the detector. Consult the instructor regarding the software controls that will permit desensitizing the detector. Information about this can be found in the Ocean View manual (see lab course website).
The spectral lamps emits a considerable amount of
radiation in the ultraviolet region. This can cause severe
eye damage. Do not stare at the bulbs. Avoid
doing more than glancing at them otherwise.
The potential across the discharge tubes is about 5000
volts. Do not touch the discharge apparatus when the power
is on.
The lamps should not be kept on continually--only when taking data. Just after you turn them off, they will still be hot to the touch, avoid getting burned. Let them cool off before handling them.
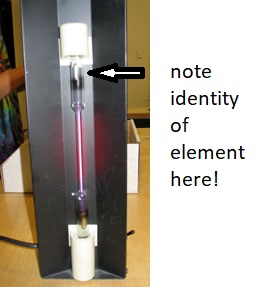
Record the name of the element by reading the label on the tube, not the label on the black discharge tube housing and power supply. Making sure that tube is not energized, and that the tube is cool enough, turn the label face forward if you need to read the label. In kindness to the next user, leave the tube face forward, and only after that, energize the tube to begin taking data.
Figure 1. On the left, a look into our modular spectrometer, showing its principal parts, and on the right, the basic setup with the plasma discharge lamp, fiber optics for light collection, and so forth.
Make a table of the wavelengths of 4 annotated strongest lines from the measured spectrum, including your best estimates of uncertainty. Explain in your lab manual how you arrived at this estimate. Search for these lines on a trusted repository of known (well attested) atomic spectral lines on the
NIST atomic lines website for calibration.
It's totally fair-dinkum (I think I've spelled this correctly...) to do this in reverse order too (find 4 strong lines on the NIST website and search for them in your observed spectra). Make a column for discrepancy, keeping very good care to note whether the experimental value is low or high (keep track of the algebraic sign of the discrepancy). How can we can infer the goodness of the calibration, and the presence or absence of systematic uncertainties for the instrument? Explain. Your interpretation of the results should be in your abstract. As with the lasers of a previous lab, you should obtain all of your spectra with the same spectrometer. How many columns will this table have? Five or six. Might not need a column for the uncertaintes of the NIST lines (probably known to more significant figures than our spectrometer can supply).
5.3 Task #2: how are energy levels associated with spectral lines?
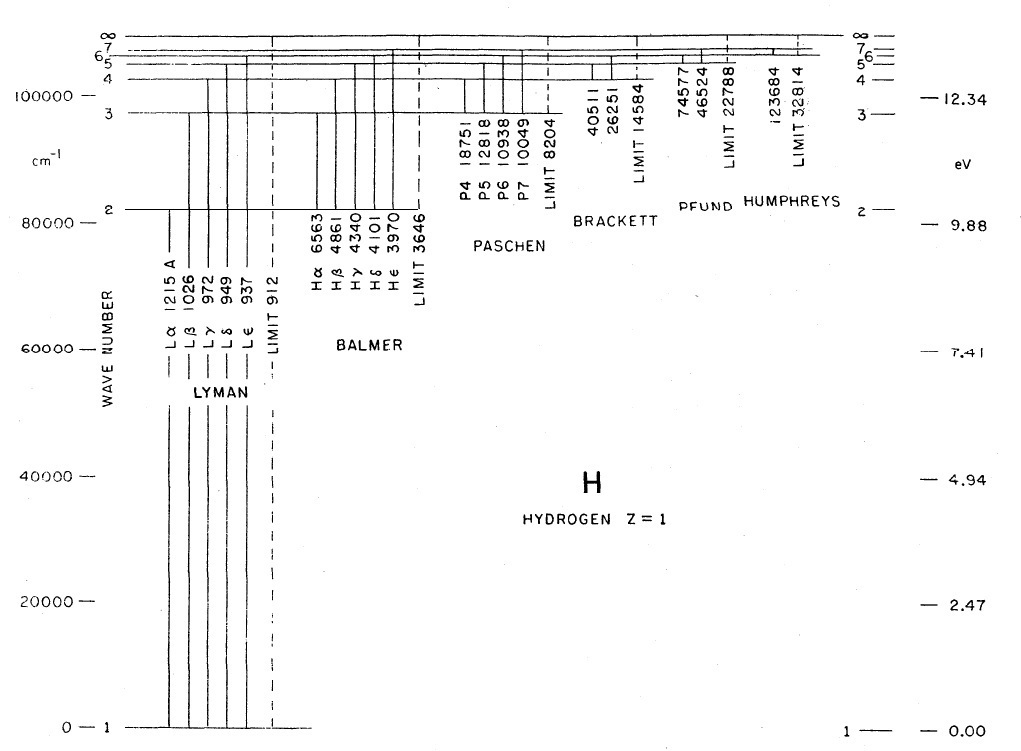
For each of the spectra obtained, create on your own a qualitatively correct sketch of an energy level diagram (ELD) that account for the 4 strongest lines. The ELD is also often called a 'partial Grotrian diagram'[1,3]; partial because not all the energy levels are shown, just the ones needed, in this case that account for the 4 spectral lines you have used for calibration in task #1. To see what one means by these Grotrian diagrams or energy level diagrams, here is one for Hydrogen, found in a book about energy level diagrams of astrophysical interest [3] published by the precursor to NIST, the former US National Bureau of Standards, here.
Figure 2. An energy level diagram for Hydrogen.
A Grotrian diagram is an energy level diagram represent energy levels as straight lines, their vertical position indicating energy, their gaps, the relative energies, and sometimes one see the horizontal lines represented as line segments separated to indicate, with letters, angular momentum, whether s, p, and d, and so forth for 0, 1, and 2 units of $\hbar$, and so forth. How do you know your sketch is any good? Well, you can get the NIST Lines database to do it for you! In fact, why not just start there (following instructions) and then transpose only the levels required to account for your lines???? This is an automatic check on progress!!!
After creating the partial Grotrian diagrams, write down your brief answers to the following questions:
What is the minimum number of energy levels required to account for 4 spectral lines? State your assumptions. Why is it possible that there are in fact many more than this to account for the 4 lines you have chosen for one particular element?
How do you know whether your sketches of energy level diagrams are any good, or are consistent with the measured spectra? To what sort of internal consistency or correctness would you appeal? Explain. I am trying to hint at the expected relative energy level gaps and the numerical value of the wavelengths.
How are all the energy levels are populated in each atom in the plasma discharge, given that it is the case that the voltage across the tube is sufficiently high to create ionization events. What's getting accelerated? How does energy get delivered to the atoms individually?
What spectrum would one see from an individual atom, if the light from one could be isolated from all the rest? Explain in terms of the quantum processes that create the spectrum. Does an individual atom exhibit the entire spectrum?
For the light sources used in these experiments, would the
absorption spectra of the element in question have the same lines as
the observed emission spectra? Explain the differences between the two types of spectra. How would one measure the absorption spectrum? Explain.
The last thing to do of course is to compose an abstract as described in the 'notes on lab notebooks' page. Be careful to make quantitative remarks about discrepancy and uncertainty, and so forth.
References:
the original reference:
Graphische Darstellung der Spektren von
Atomen Ionen mit ein, zwei und drei Valenzelectronen.
Vol II. W.
Grotrian. Julius Springer, Berlin, 1928 Handbuch der Astrophysik.
Julius Springer, Berlin
P.A.M. Dirac, 'The Principles of Quantum Mechanics', 4th Ed. Oxford Science Publication, Oxford University Press, first published 1930 (I think he was 25) and the copyright has been renewed a bejillion times.