1 Static force law characteristics of massively cross-linked hydrocarbon polymers, being, a Lab about Labs-using-Lab-Notebooks which sets expectations regarding notes on lab records, more on lab records, and still more on lab records
and as such there will be embedded coding elements regarding what goes in a lab notebook, elements that will not generally be included in the description of laboratory experiments. You will have read the page explaining the 10 things that go into a lab notebook. These items will appear below in some of the relevant places (e.g. (NB1)). References appear at the bottom of the page in brackets (e.g., [1]).
Why do experiments[1]? In what ways can one use mathematical models to analyze results of measurements? What is the point of a laboratory notebook, now that there are laptops, jump drives, cloud servers with infinite capacity, powerful software packages, and so on? Of the 3 questions, the most pressing one for this lab, and this semester, is the 3rd one. The point of this lab is to do a simple experiment with rubber bands using lab notebooks as the principal medium of record. There are no lab reports in this class, only lab notebooks and what goes into them.
There will be no points given for neatness, precise organization, or degree of detail. Instead we will focus on (1) learning to take good data, (2) modeling the data well, and (3) on creating good habits for research. We'll use lab notebooks for all of that. These things are interdependent. They suggest deliverables which should go into any reasonable laboratory notebook, which, if well done, will be a hugely important asset for any industrial or academic research lab to keep for a long time. The lab notebook is kept not just for the experimenter but for the organization that supports the lab and which presumably has an interest in the results. As we will see, it isn't just the researcher who needs to read it in the future, but also supervisors and future researchers, maybe even lawyers. The quality of that lab notebook record is judged by what future readers can make of it.
This is not meant to be a complicated experiment. Rather it is guided activity meant to illustrate the things, some of the things, that will go in the lab notebooks.
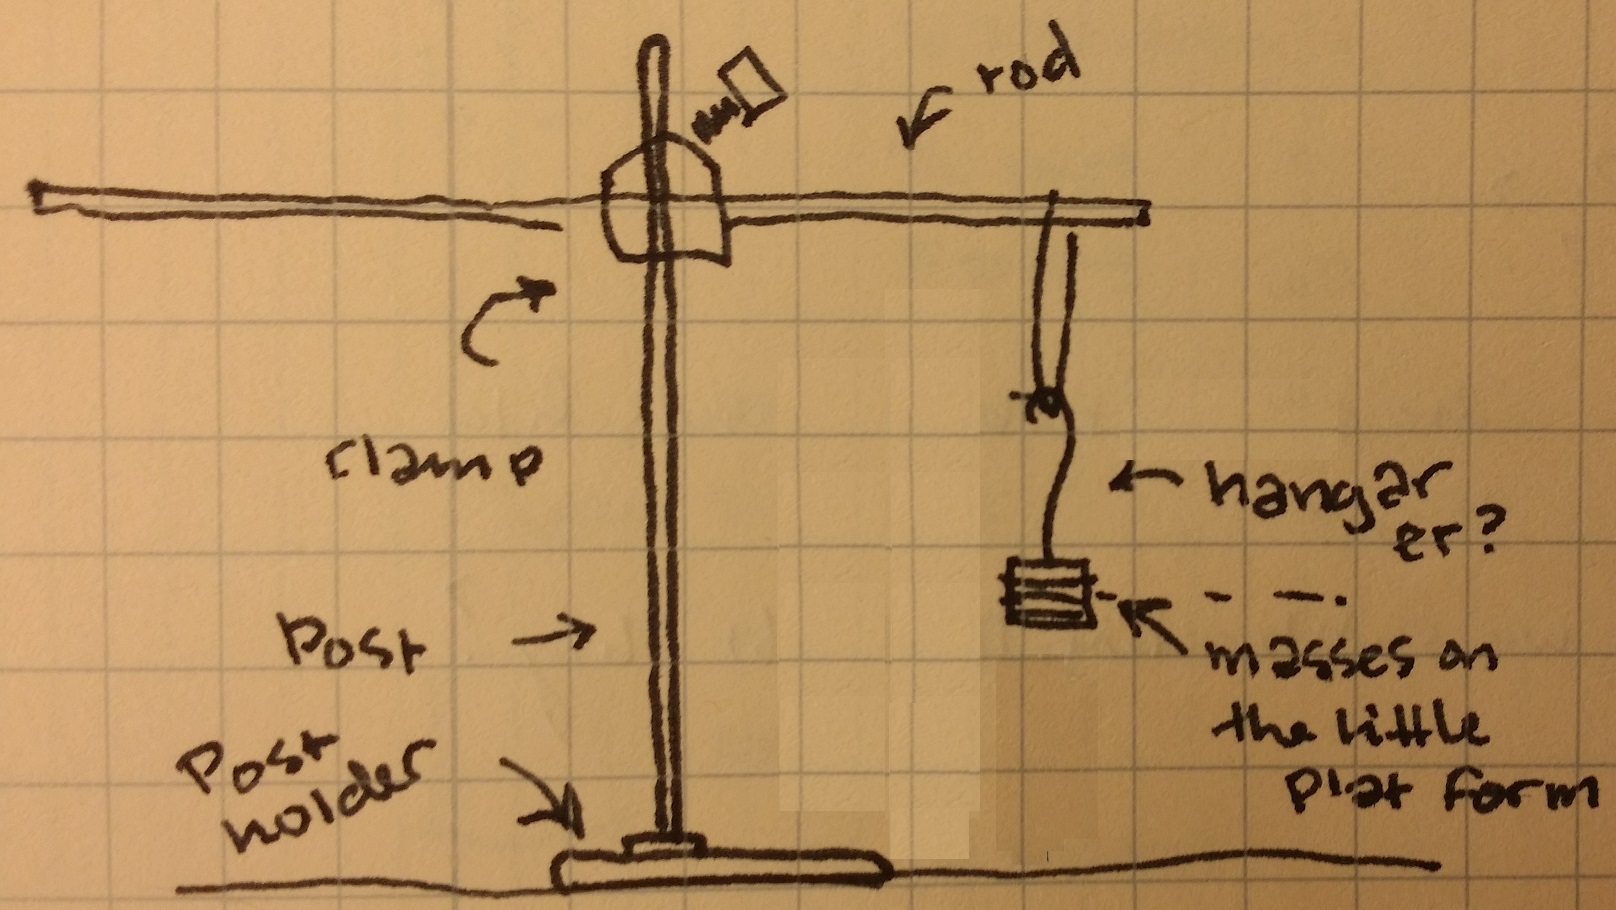
The experimental question for today is this: What is the mathematical form of the force law for an elastomer, a rubber band? As it stretches under the added weight, what force does it exert? A sketch of the apparatus is indicated below. Please note this late addition: the data taken and plotted below required the use of 4 rubber bands taken together to form a `composite' elastomer. Using one rubber band, I found that that after the heaviest mass was used, the rubber band itself had changed and the data were no longer repeatable, hence the caution below about putting too much mass on the hanger.
Make your own sketch in your lab notebook, one that determines what you are measuring (NB1). Write down 'the settings' you find necessary for the apparatus (NB2) to serve its purpose, and describe them in your lab notebook[2]. Crucial information is missing from the cartoon above. Supply this.
Write down and explain the mathematical model you have in mind for the force law, invoking functions and constants that make sense to you. It's OK if it is preliminary-it just has to be made explicit. Write down your thought about it, make a picture of it if you can, write down an mathematical equation. Even if it is only a sentence or two, make this model intelligible to the reader of the notebook (NB1, NB5). Be careful to explain how your representation of how the system works (you think) might be used make measurable predictions with the apparatus we are using. This is a step in modeling.
Prepare a table (NB4) with at least 3 columns, $m$, the mass of the hanging mass, $y$, some appropriate measure of position of the hanging mass, and the uncertainty in its position. Every column must include descriptors and units. Quantities and their uncertainties will (shall) have the same units. Some judgment will have to be exercised concerning what they are to be. Suggestion: save room for extra columns (which might occur to you later), one being for comments.
Hang a succession of masses from the elastomer [note: we'll be using 4 size #33 (3-1/2" by 1/8", Amazon) in combination, very hi-tech], recording positions. The hanger itself counts as a mass. Before hanging the 3rd mass (hanger counts as the first....) do 3 things:
Record your estimate of the uncertainty (NB6) associated with measured quantities. Record (explain) your reasoning to support those estimates.
Prepare a plot of position vs. weight or mass, something you feel is indicative of the model you have in mind (NB8). Plot it directly on the quadrille paper in your lab notebook. Be clear about units, including them in parentheses on the axes labels. It is easy (common) to forget or ignore them. Make sure your uncertainty is correctly reflected on your graph (NB6) in the form of error bars.
Once you have added 2 masses, say, after trial 2, (and before adding a third mass)
choose a next mass to add, but before you've added it, stop and and predict the new position of the hanging mass. This is obviously a modeling step, something often interleaved with experimental steps. Determine what you expect for the new displacement using the model you've indicated. However preliminary that expression was before, use it now to make a numerical prediction. Do you not know some constant or some feature of the model yet? Well, let's ask: can one use the mathematical form of the function at least to make an emperical prediction? For example, if you suppose the force grows with the square of the stretch, but you don't know the constant of proportionality, at least you could pursue the implication of the following thought- we'd have to quadruple the force to double the stretch. What does your model predict in the case you are about to test? Write down your reasoning, and perform the calculation. Plot the new position.
Then hang the mass and measure the new position. Quantitatively compare the difference between what your prediction was (we are calling this sort of thing a modeling prediction), and the actual measurement showed. That difference is a discrepancy. Plot the prediction. Plot the measurement (remembering error bars). How does the discrepancy compare with the uncertainty? Write down a sentence or two of how you interpret the comparison. This is a check on progress.
Now just take lots of data, adding masses, filling the table, adding data points on the plot, and so forth. Is a pattern emerging? Keep the upper limit of total mass under 1kg, not much more that 500g. I don't know, this isn't exact. Once you've done this, you are essentially done with the data-taking. But, is the data any good? You've checked, but not yet in a global sense.
Plot a modeling curve to fit the measured displacements. What modeling plots are, and how one make them using fitteia, are explained elsewhere. What goes into your lab notebook is enlarged upon in the references [4]. This is where your mathematical model is held up next to the data for assessment and comparison. Your aim is to make a modeling plot that looks something like the plot below, and please note, in the legend, the expression for the fitting parameter is perfectly hideous and could not be used that way, say, in an abstract [5]. a hugely important point is made in the figure caption, an odd place for something so important. From the nature of the plot and the best fit parameter, you may calculate the thing you have been looking for (probably). Express its value using significant figures appropriately, along with its uncertainty. Interpret it.
Figure 2. Modeling plot showing some sort of displacement versus some measure of mass. Included in the legend is an expression of one of the fitting parameters, having to do with the slope. Fitteia includes the graph and results in its pdf-report.
One now has some measure of a force law. What is it, is there a constant that characterizes it, and if so, what is its value and how well do you know it? How does it compare with the manufacturer's values if such exists (NB7)? Write an abstract (NB9) quoting your results, comparing uncertainties and discrepancies (if that is possible), using significant figures appropriately, capturing the essence of the methods, and interpreting what conclusions are supported by your work. Produce it (whether by using ShareLaTex, Word, or writing it out) and tape it or write it at the end of the entry for this lab. The abstract should be the last thing.
References:
A. Franklin, The Roles of Experiment, Physics in Perspective, 1 35 (1999). This paper may be found on our public course website under readings, notes, data, and stuff. The first page or two treats this very question, the answer to which might seem obvious.
NB2 is about relevant settings on equipment and are crucial if one is to understand and later reproduce phenomena and especially, to reproduce the measurements . As these are hard to anticipate ahead of time, one needs to be very keen to write them down as they are used, as the data are being collected, not later during the week when memory fades. Although this set up doesn't seem to have any 'instruments' much less 'settings'. Let me assure you that there ARE relevant 'settings' to write down of a more mechanical nature that are in fact crucial to the measurements! Write them down, note them on any relevant figures.
If in the course of one's experimental work, the uncertainties are themselves well known to correspond to a normal distribution around a mean, and this is saying something about how many times (I don't know, 100) an individual measurement is made, well, then 2 significant figures may be kept in the expression for calculated uncertainties, especially in uncertainties calculated in the process of estimating the value of $\chi^2$. There are maybe other approaches that justify the keeping of 2 significant figures in an uncertainty, but when one estimates it on the basis of a single measurement, we'll use the approach described, just one rounded up significant digit.
It will be useful to create a spreadsheet file (.CV or .XL, etc.) to cut an paste into the input buffer for the on-line curve fitting interface environment (fitteia.org). Name the file and record where it is saved (NB3). It is hoped that the table already prepared will do. Fitteia input data is of the form $x$, $y$, and $\Delta y$, corresponding to the 'independent variable', the 'dependent variable', and its uncertainty (error bars). Write down what you think those things are. A modeling formula is needed using a function
written in C - see esp. p.5 of the readme file linked here, '$3^0$-Function and Parameters'. If one uses $y = b*x$, what is 'b', how is it related to some key variable in the model? Is it that key variable you are looking to find, or are other constants (known?) bundled into it? How does one handle unit conversion factors? Would $y = b*x + c$ be a better model? What role does $c$ play, and why might you want to use it? Give it a try! Play around. Obtain a best estimate of the model parameter(s) of interest, and an estimate of the uncertainty of those parameters using this method (from the Goldilocks plot described elsewhere, or from the statistical measures determined by the fitteia routines, whichever seem to fit best). Use judgment. Explain your reasoning. Print the modeling graphs you believe are the best, and tape these into your note book. (NB6, NB8, NB5)
This expression, the one for the fitting parameter in figure 2 is perfectly hideous. The most significant digit of the uncertainty determines the least significant digit in the best value that you can be sure of, that part is OK, it's just hard to to see it at a glance. Poor use of scientific notation. Further, the most significant digit of the uncertainty is the only one you can be sure of (so round up, and display one significant digit[3]). How would one correct this expression for $b$ to make appropriate use of significant figures? Sorry for being shrill about this, but you must do the right thing in your lab notebooks.