|
C. Poverty
Poverty budget - minimum
food budget * 3
Ex. - 2002
poverty budgets
1. Poverty characteristics (Source: U.S.
Census Bureau)
| 2001
Poverty Population |
|
Persons
in Poverty (1000s) |
|
Poverty
Rate (%) |
| All
Persons |
|
32,907 |
|
11.7 |
| |
|
|
|
|
| Race
and Hispanic Origin |
|
|
|
|
| Non-Hispanic White |
|
15,271 |
|
7.8 |
| Black |
|
8,136 |
|
22.7 |
| Asian and
Pacific Islander |
|
1,275 |
|
10.2 |
| Hispanic |
|
7,997 |
|
21.4 |
| |
|
|
|
|
| Age |
|
|
|
|
| Over 65 |
|
3,414 |
|
10.1 |
| Under 18 |
|
11,733 |
|
16.3 |
| |
|
|
|
|
| Residence |
|
|
|
|
| Outside
metropolitan area |
|
7,460 |
|
14.2 |
| Inside
metropolitan area |
|
25,446 |
|
11.1 |
Inside
central cities
|
|
13,394 |
|
16.5 |
Outside
central cities
|
|
12,052 |
|
8.2 |
| |
|
|
|
|
| Type
of family |
|
|
|
|
| Married couple |
|
2,760 |
|
4.9 |
| Female-headed |
|
3,470 |
|
26.4 |
White
|
|
1,939 |
|
22.4 |
Black
|
|
1,351 |
|
35.2 |
Hispanic
|
|
711 |
|
37.0 |
| |
|
|
|
|
| Education
Level |
|
|
|
|
| No high school
diploma |
|
6,447 |
|
22.3 |
| High school
graduate |
|
5,628 |
|
9.6 |
| Some college |
|
3,025 |
|
6.6 |
| College
graduate |
|
1,625 |
|
3.3 |
|
- Female-headed households - divorce, births
to single mothers
- Must balance work and child care
- Women earn lower wages than men
- Many do not receive child support
- Working poor - over half of all poor families have
at least one worker who works some of the time
(part-time employment, low wages, underemployment), one-fifth have a
full-time worker
2. Concentration of poverty
a. Sorting
- Sorting by demand for local public
goods, demand for housing, willingness to pay for better
educational peer groups
- Low income => low levels of local
public goods, small houses, less favorable school peer
groups
- High income => high levels of local
public goods, big houses, more favorable school peer groups
b. Concentration in central cities
(1) Public transportation more
available in central cities
- Public transportation => slow, low
monetary costs
- Low income => low opportunity cost
of time, limited income
(2) More generous redistribution
policies - subsidized housing, income transfers
c. Spatial mismatch - jobs
in suburbs, poor in central cities,
contributes to poverty
- Employment growth lower in central
city neighborhoods
- Longer commutes => higher
unemployment
- Transit not oriented towards central
city-to-suburb commute
3. Consequences of sorting and segregation
a. Income sorting
- Less spent on schools in poor
neighborhoods
- Drug problems, crime, family instability,
health problems, language difficulties, weak educational support and
preparation in poor neighborhoods
- High dropout rates, lower education
quality, low test scores
b. Racial segregation
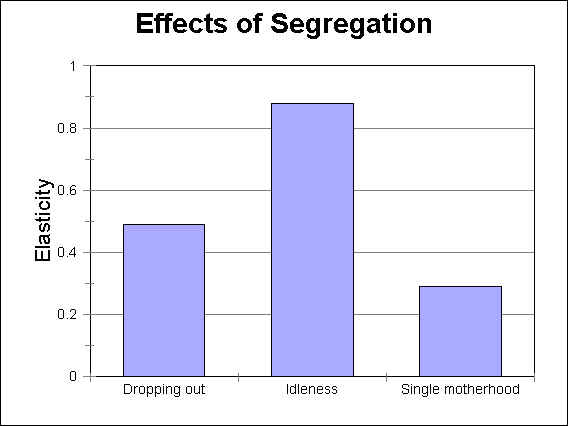
- Lack of role-models a problem
c. Public policy
(1) Eliminate barriers to integration
- Enforce fair-housing laws
- Reduce exclusionary zoning
- Spread low-income housing policies
throughout region
(2) Dispersing central city residents
- Pros - jobs in suburbs, break up
concentrations of poverty
(negative externalities), more
positive role models
- Cons - communities disrupted,
poorest left behind
(3) Developing the central city -
"Black Capitalism," enterprise
zones (lower taxes, worker training subsidies,
exemptions from local regulations)
- Pros - communities maintained,
central city remains significant
- Cons - market forces working
against central cities, residents
may not have the right skills
4. Labor market discrimination
- Different wages for equally productive
workers
.
.
.
.
.
.
.
.
- Differences in hours worked, education,
experience, and location explain much of
gap in wages, rest due to discrimination
by race and gender
- Discrimination penalty shrinking over
time
5. Poverty and public policy
a. Cash payments
- Aid to Families with Dependent
Children (AFDC)
- Supplemental Security Income (SSI)
- aged, blind, disabled
b. In-kind payments
- Medicaid - medical care for the
poor
- Food stamps - coupons that can be
exchanged for food
c. Welfare reform
(1) Personal Responsibility and
Work Opportunity Reconciliation Act of 1996
- Block grants to states - Temporary
Aid to Needy Families (TANF)
- After 24 months of assistance,
recipients must participate in
employment, training, community
service, etc.
- Lifetime maximum of 60 months of
assistance
- Child care subsidies for working
parents
(2) State results
- Reform leads to higher expenditures
- Expenditures for medical care, child
care, and transportation needed for
programs to be successful
(3) Consequences
- Welfare caseloads reduced
- More single mothers employed
- Net increase in income
- Number of families in deep poverty
(< half of poverty level) increased - 40% of former
recipients not working
- Incomes for bottom fifth decreasing
- average wage is $7 an hour
(4) Questions
- What happens in an economic
downturn?
- Will human capital translate into
higher wages later?
- How will family structure be
affected?
(5) Labor market impact
.
.
.
.
.
.
.
.
|