|
IV. Crime, Housing, and
Government
A. Crime
1. Crime facts
a. FBI index crimes
- Personal crime
- victim placed in physical danger
(homicide, rape, aggravated assault) or
show of force used to coerce victim to
steal property (robbery)
- Property crime
- burglary (illegal entry of a building),
larceny, auto theft
| |
Crimes
per 100,000 people |
| |
1960 |
1970 |
1980 |
1990 |
1995 |
1999 |
| Personal Crime |
|
|
|
|
|
|
| Murder |
5.0
|
7.8
|
10.2
|
9.4
|
8.2
|
5.7 |
Rape
|
9.5
|
18.6
|
36.8
|
41.2
|
37.1
|
32.7 |
Aggravated
assault
|
85.2
|
176.9
|
298.5
|
424.1
|
418.3
|
336.1 |
Robbery
|
59.5
|
187.2
|
251.1
|
257.0
|
220.9
|
150.2 |
Property
Crime
|
|
|
|
|
|
|
Auto theft
|
182
|
457
|
502
|
658
|
561
|
420 |
Larceny
|
1,024
|
2,124
|
3,167
|
3,184
|
3,045
|
2,551 |
Burglary
|
504
|
1,152
|
1,684
|
1,236
|
988
|
770 |
Total
index crimes
|
1,870
|
3,949
|
5,950
|
5,820
|
5,278
|
4,266 |
- Not counted:
disorderly conduct, shoplifting, arson,
employee theft, possession and sale of
narcotics, public drunkenness, drunk
driving
- Drop in 1990s due to increased
incarceration rates, changes in demographics (# of 18 - 24
year olds), different drug use patterns, crime control
techniques, economic growth
b. Victims of crime
(1) Income
- Violent crime -
rate decreases as income increases
- Property crime -
rate increases as income increases
(2) Place of residence
Victimization
Rates in 1993 (per 1,000 households
or 1,000 persons 12+)
|
| |
Robbery |
Assault |
Theft |
Household
Burglary |
Auto
Theft |
| Central cities |
11 |
55 |
292 |
84 |
34 |
| Suburban areas |
5 |
39 |
241 |
47 |
17 |
| Rural areas |
3 |
37 |
190 |
54 |
7 |
(3) Race
Victimization
Rates in 1993 (per 1,000 households
or 1,000 persons 12+)
|
| |
Robbery |
Assault |
Theft |
Household
Burglary |
Auto
Theft |
| White |
5 |
42 |
241 |
57 |
17 |
| Black |
13 |
51 |
250 |
86 |
34 |
(4) Price of housing
- One percentage
point increase in burglary rate =>
$336 decrease in average property value
- One incident per
1,000 increase in vandalism rate =>
$117 decrease in average property value
- Elasticity of
property values with respect to crime =
-0.067
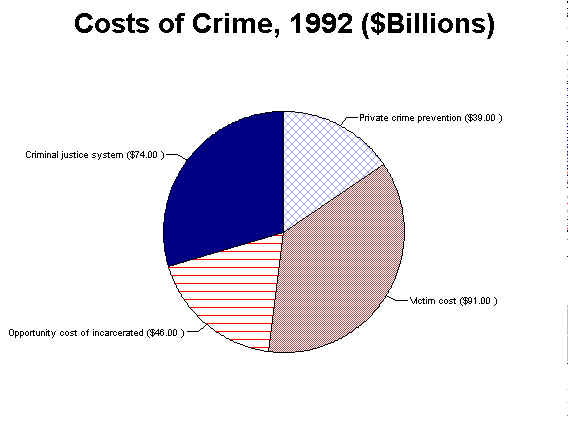
(5) Cost of crime
2. Supply of crime
a. Rational criminal
.
.
.
.
.
.
.
.
.
- Crime committed if net
return > anguish cost
b. Supply curve of crime
.
.
.
.
.
.
.
.
- Positive intercept
because of anguish cost
- Positively sloped -
more criminals, more crimes per criminal
as net return increases
- Crime fighting reduces
net return, movement down supply curve
- Supply shifts when
aversion to crime changes
3. Optimum amount of crime
- Crime prevention has a
cost => optimum amount of crime is
positive
- Compare benefit of
prevention with cost
a. Total approach
.
.
.
.
.
.
.
.
b. Marginal approach
.
.
.
.
.
.
.
.
4. Crime prevention
a. Increase value of legal
opportunities
- Negative relationship
between crime and real wages
- Weak relationship
between unemployment and crime, stronger
for first-time offenders
- Need to improve economic prospects
b. Hardening the target
- Use protective devices
- Reduces probability of
success
- Moral hazard -
insurance weakens incentive to prevent
theft
c. Increase probability of arrest
- Hire more police
- Increases probability of punishment
d. Increase probability of imprisonment
- Increases probability of punishment
e. Increase severity of punishment
- Increases total cost of crime
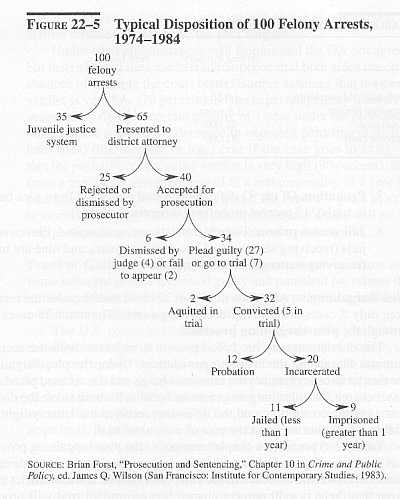
5. Criminal justice system
a. Police
- Arrest
ratio - # of arrests / # of crimes
committed
- Elasticity of crime
with respect to arrest ratio = -0.30 for
robbery, burglary, larceny (Levitt, 1998)
- 10% increase in
spending on police => 4.7% increase in
average length of time a youth is a law
abiding citizen (Tauchen, 1994)
- Foot patrols more
effective than car patrols - speeds up reporting of
crimes
- Clearance rate - # of
convictions / # of arrests
b. Court system
- Plea bargaining -
criminal charge reduced in exchange for
guilty plea, cost of trial avoided
c. Prison system
Functions:
(1) Rehabilitation
- Studies show that
rehabilitation programs don't reduce recividism
rate - percentage of convicts
arrested for another crime
- Reasons: Difficult
to change antisocial attitudes,
convicts committed to crime by the
time they are in prison, difficult
for criminals to get equally
lucrative legal opportunities
- Anticrime programs
targeted on youths pass benefit-cost
test
- Parole -
convict released when parole board
says s/he is rehabilitated, evidence
mixed
(2) Deterrence
- Certainty of
punishment a greater deterrence than
severity of punishment
- Length of time
served doesn't deter crime because
criminals hardened (reduced anguish
cost), "prison schooling"
(increased probability of success),
high discount rate
.
.
.
.
.
.
.
(3) Incapacitation
- Take criminals out
of circulation
- 17 to 21 crimes
avoided by keeping typical criminal
in prison for one year
- Cost of
imprisonment = $23,000 per year
- Three Strikes' Laws - heavy
penalties for repeat offenders
- Not cost effective if only an
incapacitation effect
- Cost effective if impact has a
deterrence effect
- Studies show deterrence is more
effective than incapacitation
(4) Retribution
- Punish criminals
for actions
6. Principle of marginal deterrence
- Greater penalty for more serious crimes
(higher social costs)
.
.
.
.
.
.
.
.
.
.
.
.
7. Crime and city size
- Crime rates increase with
city size
- Higher payoff in big
cities (responsible for 25% of the difference)
- Lower probability of
arrest (bigger pool of suspects, more impersonal)
(15%)
- Higher concentration of
female-headed households (50%)
8. Drugs and property crime
- Positive relationship
between drug use and criminal activity,
causal link unclear
- Supply-side policies
increase total expenditures, property
crimes likely to increase
- Demand-side policies
decrease total expenditures and property
crimes
.
.
.
.
.
.
.
.
|