|
Home
Leading Economic Indicators
Up in March
Note: After supplying building permit data on a regular basis
for the USD Index for nearly 20 years, changes at the Construction Industry
Research Board (CIRB) have led to delays in the reporting of building permit
data and the release of the monthly report.
Data has now been released for February and March and the California
Homebuilding Foundation (CHF) is in the process of taking over the CIRB
functions. The CHF plans to begin
releasing data this summer but has not announced an exact date so the date of
the next Leading Economic Indicators Index is uncertain.
My thanks to Ben Bartolotto of the
Construction Industry Research Board for all his help over the years.
May 31, 2012 --
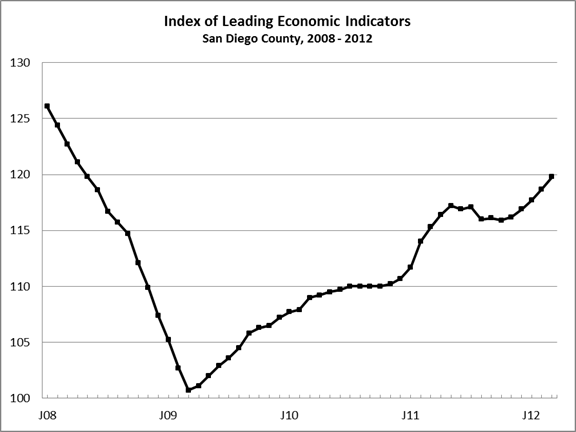
The USD Burnham-Moores Center for Real Estate’s Index of Leading Economic
Indicators for San Diego County rose 0.9 percent in both February and March.
For March, five of the six components were up, with particularly large
gains in initial claims for unemployment insurance and consumer confidence.
There were smaller increases in building permits, help wanted
advertising, and the outlook for the national economy.
The only component not advancing was local stock prices, and they were
unchanged.
With the two positive months, the USD Index had advanced for
five consecutive months through March.
Also positive was a pickup in the strength and breadth of the advance,
with many components up and up significantly.
This suggests continued growth in the local economy through the end of
2012, with the pace picking up towards the end of the year.
Highlights:
Residential units authorized by building permits
started the year negatively, with total units authorized for the first quarter
down almost 23 percent compared to the first quarter of 2011.
Single-family units authorized were particularly hard hit:
they fell by 28 percent in the first quarter, compared to a loss of 20
percent for multi-family units authorized. . . Both labor market variables
continue to be positive.
Initial claims for unemployment insurance
have fallen for seven months in a row, which is a positive for the Index.
The programs extending the duration of unemployment insurance have never
been included in the calculation of this component, so legislation cutting back
on those benefits have no impact here.
On the hiring front,
help wanted advertising
has increased for 16 consecutive months.
The
net result was that the local unemployment rate fell below 9 percent again to
8.7 percent in April, which is the lowest unemployment rate since February 2009.
This compares to an unemployment rate of 9.6 percent in March and 9.7
percent in April 2011. . . Consumer confidence continues to
improve, even though gas prices surged in the two months covered by this report.
In the past, there has been a significant correlation between increases
in gas prices and a fall in consumer confidence. . . Even though local
stock prices were flat in March, the first quarter was a good one for
local stocks, which were up 14.9 percent.
This compares to gains of 8.1 percent in the Down Jones Industrial
Average, 12.0 percent in the S&P 500 Index, and 18.7 percent in the NASDAQ
Composite Index. . . Despite sluggish growth for the national economy, the
outlook remains positive, with the national Index of Leading Economic
Indicators having advanced for 11 months in a row.
The “advance” estimate for Gross Domestic Product growth for the first
quarter was 2.2 percent, down from 3.0 percent in the fourth quarter
but above the 1.7 percent growth rate for
2011 as a whole.
March’s increase puts the USD Index of Leading Economic
Indicators for San Diego County at 119.8, up from 118.7 in February.
For revisions to the previously reported values for the Index, for the
monthly change, and for changes for the individual components, please visit the
Website address given below. The
values for the USD Index for the last year are given below:

For more information on the University of San Diego's Index of Leading
Economic Indicators, please contact:
|