|
Home
Leading Economic Indicators
Up in July
Note: The tentative release date for next month's
report is September 27.
August 30, 2011 --
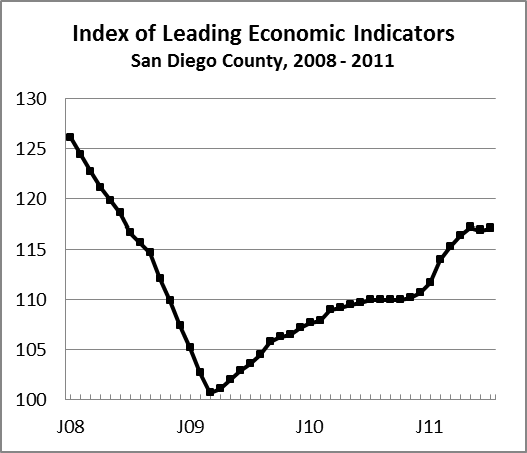
The USD Burnham-Moores Center for Real Estate’s Index of Leading Economic
Indicators for San Diego County rose 0.2 percent in July.
Leading the way to the upside were strong gains in help wanted
advertising and the outlook for the local economy.
Local stock prices were also up moderately.
These outweighed a sharp drop in consumer confidence and smaller declines
in building permits and initial claims for unemployment insurance to push the
USD Index to its eighth gain in nine months.
There was some concern when last month’s report showed the
first drop in the USD Index in 27 months.
While the gain in July reduced some of those concerns, there are still
some worries about the possibility of a double dip recession, both locally and
at the national level. The
probability of a recession is probably less than 50 percent, but the probability
is significant and is growing. A
drop in consumer confidence and the lack of income due to high unemployment has
adversely affected personal consumption expenditures, which is about 70 percent
of economy activity. That,
combined with a drop in government expenditures as all levels of government cut
back to deal with deficits, has caused the Gross Domestic Product (GDP) to slow
to a crawl. Add to that a weak
housing and real estate market, increased inflation, and political turmoil over
fiscal policy and the ingredients for a downturn are there.
Whether this is enough or whether a further triggering mechanism is
needed remains to be seen.
Highlights:
The trend in
residential units authorized by building permits
was negative for the second straight month.
A moving average is used to determine the trend by smoothing the
month-to-month fluctuations in volatile components such as residential units
authorized. . . The labor market variables remain mixed, with
initial claims for unemployment insurance
negative for the second month in a row, while help wanted advertising was
up for the seventh straight month.
The latter move put online help wanted advertising at its highest level since
November 2008. The net result was
that the local unemployment rate rose to 10.5 percent in July from 10.4 percent
in June. The increase in the
unemployment rate is not as negative as it seems since July is usually the
highest month of the year in terms of the unemployment rate, as students and
others involved in education entered the labor force looking for summer jobs. .
. Consumer confidence continues to plummet as the drumbeat of bad news
about the economy takes its toll.
Particularly impacted are purchases of big ticket items such as automobiles,
furniture, housing, etc., as consumers tend to be more hesitant to take on debt
when they are worried about their jobs and income. . . Although the stock market
has been very volatile (mostly to the downside) in August, local stock prices
registered a solid gain in July. . . Despite all the bad economic news and
worries about a double dip recession, the national Index of Leading Economic
Indicators continues to move upward.
One negative item was the second estimate of GDP growth for the second
quarter of 2011, which showed the national economy growing at an anemic 1.0
percent annual rate. This was down
from the advance estimate for the quarter, but was still higher than the even
more anemic growth rate of 0.4 percent for the first quarter.
July’s increase puts the USD Index of Leading Economic
Indicators for San Diego County at 117.1, up from June’s revised reading of
116.9. Revised data for building
permits, local stock prices, and consumer confidence led to the revision of the
level of the USD Index for June, but there was no revision in the previously
reported change of -0.2 percent for the month.
Please visit the Website address given below to see the revised changes
for the individual components. The
values for the USD Index for the last year are given below:

For more information on the University of San Diego's Index of Leading
Economic Indicators, please contact:
|