|
Home
Leading Economic Indicators
Up in August
Note:
The tentative release date for next month's report is October 26.
September 29, 2010 --
The
USD Burnham-Moores Center for Real Estate's
Index of Leading Economic Indicators for San Diego
County was unchanged in August. Although there was no decline, the unchanged
reading breaks a string of 16 consecutive increases in the USD Index. Four of
the components were up: Help wanted advertising and the outlook for the national
economy registered medium-sized gains while local stock prices and consumer
confidence were positive but virtually unchanged. Rounding out a month that saw
no significant changes in either direction, building permits declined moderately
while initial claims for unemployment insurance were slightly negative.
 |
Index of Leading Economic
Indicators
The index for San Diego County that includes the
components listed below (August)
Source: USD Burnham-Moores Center for Real Estate |
+ 0.0 % |
 |
Building Permits
Residential units
authorized by building permits in San Diego County (August)
Source: Construction Industry Research
Board |
- 0.64% |
 |
Unemployment Insurance
Initial claims for unemployment insurance in San Diego County, inverted
(August)
Source: Employment Development Department |
- 0.13% |
 |
Stock Prices
San Diego Stock Exchange Index (August)
Source:
San Diego Daily Transcript |
+ 0.08% |
 |
Consumer Confidence
An index of consumer confidence in San
Diego County (August)
Source:
San Diego Union-Tribune |
+ 0.02% |
 |
Help Wanted Advertising
An index of online help wanted advertising in
San Diego (August)
Source: Monster Worldwide |
+ 0.35% |
 |
National Economy
Index of Leading Economic Indicators (August)
Source: The Conference Board |
+ 0.53% |
August’s unchanged reading is the latest sign
of continued choppiness in the local economy. The USD Index has still not turned
negative, so there is no sign of an impending downturn. But growth in the local
economy is likely to be uneven, with fits and starts along the way. Job growth
continues to be weak and will likely remain so for a long time. While better
than in previous months, the economy is down almost 10,000 jobs in August
compared to the same time last year. Among the hardest hit sectors are
manufacturing (down 2,900 jobs), leisure and hospitality (2,700), government
(2,300), retailing (2,200), finance and real estate (2,200), and construction
(1,500). The only sectors showing year-over-year gains are health
care (up 2,600) and
business and professional
services (2,700). The latter category is important because it is largely due to
big increases in temporary employment, which is often a precursor to full-time
employment.
Highlights:
Residential units authorized by building permits turned negative in August
after advancing for eight months in a row. Despite the downturn, permits are
still more than 32 percent ahead of the pace of 2009. One indication of the
difference in the two years is that 141 multi-family units were authorized in
August this year versus only six in August of 2009. . . The labor market
components remain mixed, although the rate of change slowed for both. Initial
claims for unemployment insurance were negative for the fifth consecutive
month, but the drop was the smallest of the five months. On the hiring side of
the labor market, help wanted advertising rose for the tenth straight
month, but the gain was less than in recent months. The net result was that the
local unemployment rate fell to 10.6 percent in August from a rate of 10.9
percent in July. . . The trend in local consumer confidence has shifted
to being virtually flat after recent gains. The raw value for consumer
confidence actually fell sharply in August, but the USD Index uses a moving
average to smooth out month-to-month fluctuations and capture the overall trend.
. . Local stock prices are calculated using the average daily value for
the entire month. That methodology yielded a gain for local stocks in August,
even though stock prices fell by more than five percent from the beginning of
the month to the end. The average daily value in August was higher than the
average daily value in July. …. Despite concerns about a double dip recession,
the national Index of Leading Economic Indicators has now been up in 15
of the last 17 months.
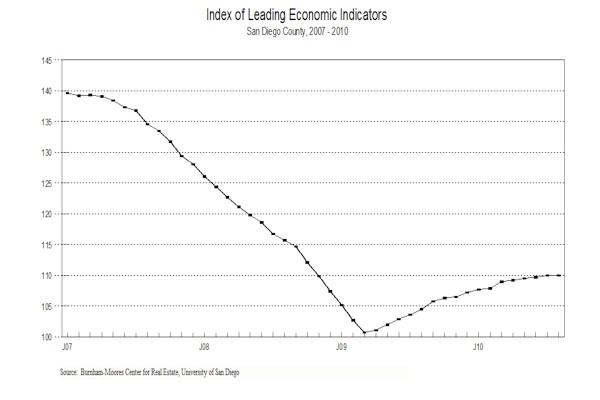
August’s increase puts the USD Index of Leading Economic Indicators for San
Diego County at 110.0, unchanged from July’s revised reading. Revised values for
building permits for July and for the national Index of Leading Economic
Indicators for June and July led to revisions in the Index for those months but
did not affect the previously reported changes. Please visit the Website address
given below to see the revised changes for the individual components. The values
for the USD Index for the last year are given below:
For more information on the University of San Diego's Index of Leading
Economic Indicators, please contact:
|