|
Home
Leading Economic Indicators
Up Sharply in March
Note:
The tentative release date for next month's report is May 25.
April 28, 2010 -- The University of San
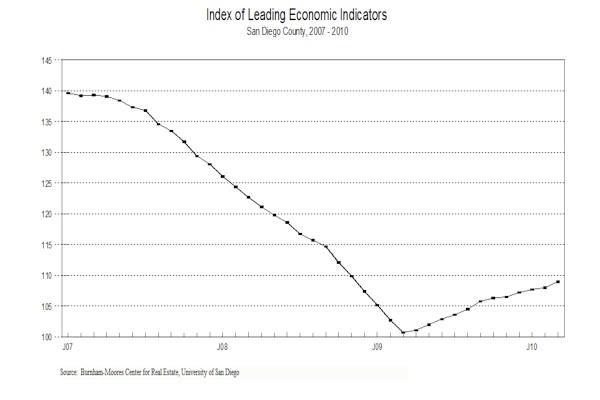
Diego's Index of Leading Economic Indicators for San Diego County rose 1.0
percent in March. Leading the way to the upside were strong moves in local stock
prices and the outlook for the national economy. Building permits, initial
claims for unemployment insurance, and help wanted advertising were also
positive, but to a lesser extent. The only down component was local consumer
confidence, which fell slightly. With March’s advance, the USD Index has now
been up for 12 months in a row.
 |
Index of Leading Economic
Indicators
The index for San Diego County that includes the
components listed below (March)
Source: University of San Diego |
+ 1.0 % |
 |
Building Permits
Residential units
authorized by building permits in San Diego County (March)
Source: Construction Industry Research
Board |
+ 0.21% |
 |
Unemployment Insurance
Initial claims for unemployment insurance in San Diego County, inverted,
estimated (March)
Source: Employment Development Department |
+ 0.60% |
 |
Stock Prices
San Diego Stock Exchange Index (March)
Source:
San Diego Daily Transcript |
+ 1.97% |
 |
Consumer Confidence
An index of consumer confidence in San
Diego County (March)
Source:
San Diego Union-Tribune |
- 0.44% |
 |
Help Wanted Advertising
An index of online help wanted advertising in
San Diego (March)
Source: Monster Worldwide |
+ 0.87% |
 |
National Economy
Index of Leading Economic Indicators (March)
Source: The Conference Board |
+ 2.68% |
The outlook for the local economy remains
unchanged from recent months: If the local economy did not bottom out at the end
of 2009, it likely did in the first part of 2010. As was mentioned in previous
reports, employment is the indicator that comes out most regularly at the local
level, and employment tends to be a lagging indicator in recent recessions and
recoveries. March employment numbers show a gain of 5,000 jobs compared to
February, which was the best monthly gain in local employment since February
2008. The unemployment rate still edged up for the month (see below) because
more workers returned to the workforce in search of employment, which itself is
a positive development. It is a sign that the unemployed are a little more
optimistic about their prospects and no so discouraged as to give up looking for
work altogether.
Highlights:
Residential units authorized by building permits finished the first
quarter of 2010 up 21 percent compared to the same period in 2009. The recent
strength in the owner-occupied housing market in terms of prices and sales led
to a single-family permits nearly doubling (up 97 percent) in the quarter.
However, activity in multi-family construction remains weak, with permits down
almost 36 percent compared to the first quarter of 2009. . . Both of the labor
market components continue to do well. Initial claims for unemployment
insurance fell for the sixth straight month, which is a positive for the
Index, while help wanted advertising was up for the fifth straight month.
Help wanted advertising is now at its highest level since December 2008.
However, the local unemployment rate remains at a high 11 percent in March,
compared to revised rates of 11.1 percent in January and 10.7 percent in
February. . . The trend in local consumer confidence continues to be
negative, although, as in the past, the raw value for the component was actually
higher in March. Local consumer confidence has now fallen over 13 percent
compared to the recent peak reached in August of last year. . . Local stock
prices rebounded with the rest of the financial markets to finish up 10.6
percent for the first quarter. . . The national Index of Leading Economic
Indicators continues to advance solidly and has now also been up for an
entire year. The labor market appears to be improving, with the national economy
adding 162,000 jobs in March, which was the strongest gain since March 2007.
Growth in the Gross Domestic Product (GDP) for the fourth quarter of 2009 was
revised downward but still remained strong at a 5.6 percent annual rate.
March’s increase puts the USD Index of Leading Economic
Indicators for San Diego County at 109.0, up from February’s revised reading of
108.0. Revisions in building permits and the national Index of Leading Economic
Indicators affected the previously reported changes and level of the USD Index
for both January and February. Please visit the Website address given below to
see the revised changes for the individual components. The values for the USD
Index for the last year are given below:

For more information on the University of San Diego's Index of Leading
Economic Indicators, please contact:
|