|
Home
Leading Economic Indicators
Unchanged in October
Note:
Due to the holidays, the release date for next month's report is uncertain.
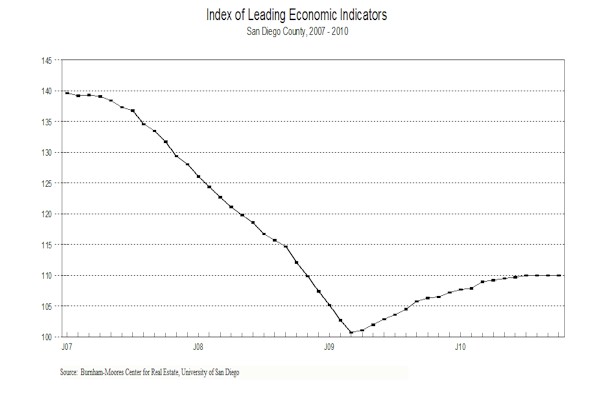
November 30, 2010 -- The
USD Burnham-Moores Center for Real Estate’s Index of Leading Economic Indicators
for San Diego County was unchanged in October, despite the fact that five of the
six components in the Index were positive during the month. The outlook for the
national economy was up sharply, initial claims for unemployment insurance and
local stock prices were moderately positive, and consumer confidence and help
wanted advertising also increased, but just barely. These gains were offset by a
huge drop in building permits to leave the USD Index unchanged for the third
straight month.
 |
Index of Leading Economic
Indicators
The index for San Diego County that includes the
components listed below (October)
Source: USD Burnham-Moores Center for Real Estate |
+ 0.0 % |
 |
Building Permits
Residential units
authorized by building permits in San Diego County (October)
Source: Construction Industry Research
Board |
- 2.21% |
 |
Unemployment Insurance
Initial claims for unemployment insurance in San Diego County, inverted
(October)
Source: Employment Development Department |
+ 0.48% |
 |
Stock Prices
San Diego Stock Exchange Index (October)
Source:
San Diego Daily Transcript |
+ 0.65% |
 |
Consumer Confidence
An index of consumer confidence in San
Diego County (October)
Source:
San Diego Union-Tribune |
+ 0.04% |
 |
Help Wanted Advertising
An index of online help wanted advertising in
San Diego (October)
Source: Monster Worldwide |
+ 0.09% |
 |
National Economy
Index of Leading Economic Indicators (October)
Source: The Conference Board |
+ 1.05% |
There was some initial
concern when last month’s report showed the first drop in the USD Index in 18
months. But that decline was revised upward to unchanged (see below), so no
turning point to the downside has been signaled. The outlook remains for slow
but positive growth for the local economy at least through the first half of
2011. One area that has been improving has been the labor market. While the news
is still bad, with the unemployment rate above 10 percent now for 17 straight
months, the situation is relatively better than during the depths of the
downturn. In October, non-farm wage and salary employment was down 1,100 from
October 2009, which was the best year-over-year comparison since April 2008.
With hints of a stronger Christmas buying season, it is likely that the
year-over-year comparison will turn positive in November and December for the
first time since the Great Recession began.
Highlights: Residential units authorized by building
permits fell to their lowest level of 2010 in October. While single-family
permits are still holding up, multi-family units are down slightly through
October compared to the same period in 2009 . . . The labor market components
were both positive for the first time since March of this year. The pace of job
loss slowed, with initial claims for unemployment insurance hitting the
lowest level of the year, both in absolute and in seasonally adjusted terms. The
hiring side of the market was virtually unchanged, although slightly positive,
with help wanted advertising increasing for the 12th
consecutive month. The net result was that the local unemployment rate dropped
to 10.2 percent in October, which is down from the 10.6 percent rate of
September. . . Local consumer confidence remains volatile on a
month-to-month basis, with the actual value of the index down for October
compared to September. But when the volatility is smoothed out using a moving
average, the trend is still slightly positive. . . After slumping in the late
spring and early summer, local stock prices advanced for a third straight
month, following the rally in the broader financial markets. . . The national
Index of Leading Economic Indicators turned in a second strong advance and
has now been up four months in a row. The "second" estimate for Gross Domestic
Product (GDP) for the third quarter showed growth at a 2.5 percent annualized
rate, up from the 1.7 growth rate of the second quarter and the fifth
consecutive quarter of positive GDP growth.
October’s unchanged reading puts the USD Index of Leading
Economic Indicators for San Diego County at 110.0, the same as September’s
revised level. A big upward revision in the national Index of Leading Economic
Indicators caused the change in September to be revised upward to unchanged from
the previously reported drop of 0.1 percent. Please visit the Website address
given below to see the revised changes for the individual components. The values
for the USD Index for the last year are given below:
For more information on the University of San Diego's Index of Leading
Economic Indicators, please contact:
|