'Work Products' for this lab - what should be completed and turned in (put in your ELN).
Using nematode genomic sequence (Oscheius myriophila, a relative of the better-known C. elegans) is convenient because gene density is relatively high - that is, there are typically several genes in a relatively small sequence.
Directory of O. myriophila genomic sequences.
Find your assigned genomic sequence and save it to your computer (as a plain text file).
FGENESH - a gene prediction program. [Note: we may have a limited number of free uses from USD's internet domain - use it ONCE today and get your info.]
1. Click [Show advanced options] to see what's available, and:
unselect 'print mRNA sequences for predicted genes' since we won't be using it.
2. Select 'Caenorhabditis elegans' for Organism (start typing in the window and it will show up). [The program doesn't have a setting specifically for Oscheius.]
3. Given the size of sequence, it's probably best to use the 'Choose File' button to select the file from your computer. [Or, paste your assigned genomic sequence into the sequence window - but sometimes the sequence is truncated when paste is used. If you use the 'paste' method, you must confirm the correct length of the sequence in the FGENESH output. ]
4. Click the "Search" button.
5. How many genes are predicted in your genomic sequence? Are they large or small? Do they have few or many exons?
Calculate a measure of the (predicted) gene density: Divide the total sequence length by the number of predicted genes - this tells you that, on average, a gene is found every N basepairs.
Compare your calculations to others in the class.
Guide to interpreting the FGENESH results
6. Save the resulting file to use in Exercise 7 below (and for a brief report on the results). You will use the predicted protein sequences in exercise 7B. The PDF version creates a nice graphical view of each predicted gene plus all the sequences (and is easier to save).
Compare how the predictions differ if (using FGENESH again) you select 'Pristionchus pacificus' for Organism instead - this is the next closest nematode relative in the list. The predictions are likely to be similar but not identical. Record just the summary, as shown in the 'Work Products' instructions.
Optional: Compare the genes found with FGENESH with another prediction program: GeneMark.hmm - how similar or different are the results? [As with FGENESH, choose C. elegans for the organism.]
Exercise 6B - Identify Splice Site signals in your sequence:
Annotate two Exon-Intron boundaries in one of your genes
A. Search for genes in your genomic sequence by homology using BLASTX - this strengthens genefinder predictions from above, and also may find genes NOT predicted by the genefinder.
1. From the NCBI BLAST Server again, click on blastx.
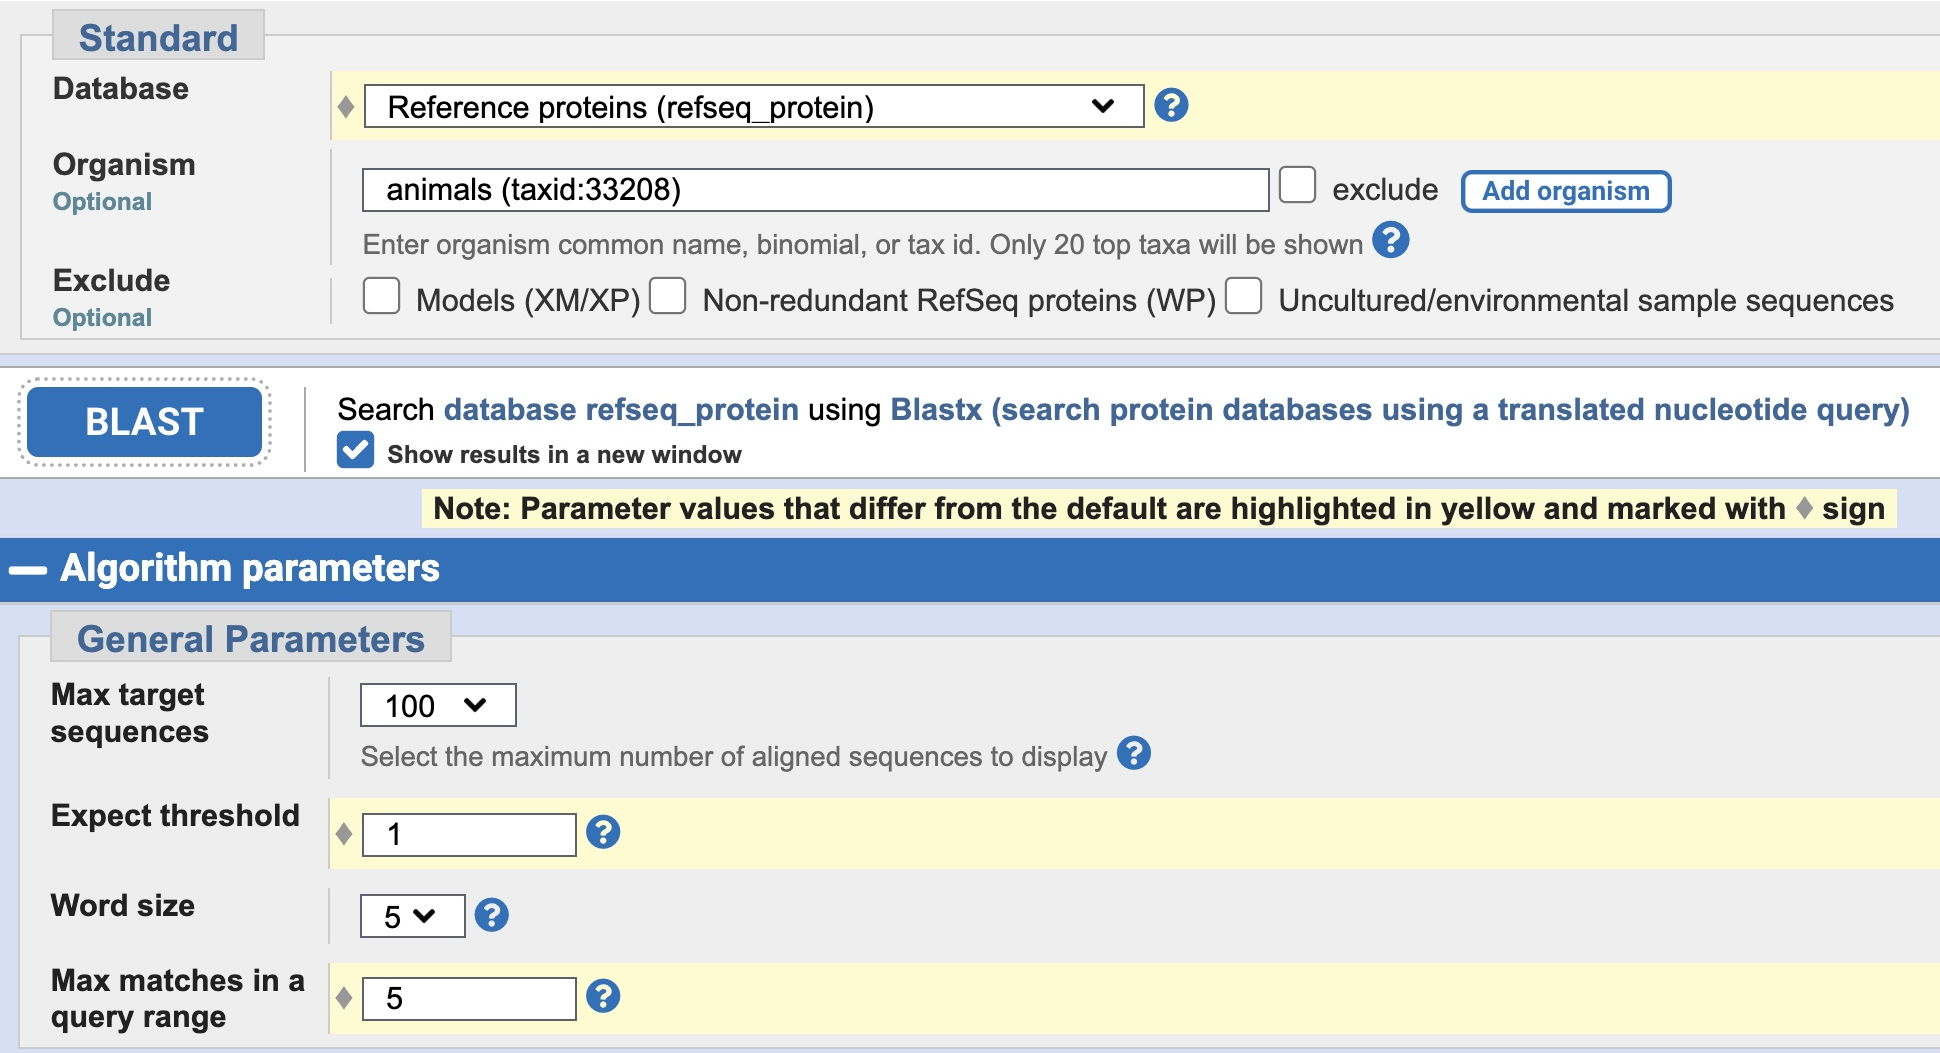
2. Choose your assigned genomic sequence to upload. Change the Database to 'RefSeq Select proteins (refseq_select).' Enter 'animals' in the Organism box (as shown below). We also need to change some default parameters - see the image below for the changes - they are highlighted in yellow, as they will be when you make the changes. First, change the database, and then click on Algorithm Parameters to make the other changes. Change Expect threshold to 1, and change Max matches in a query range to 5 (also as shown below).

After parameters are changed, click the BLAST button, and examine the results. (Note that this search may take a few minutes to be completed - while you're waiting for that window, you could begin part 7B below. But be sure to keep track of which new window goes with each search that you perform.) Note the locations of homologies detected relative to proteins predicted by FGENESH - how well do they match up? Did FGENESH miss predictions of some regions detected by BLASTX?
[What if you get nothing or very little in this BLASTX search? Change the Database to 'refseq_protein' or back to the default setting 'nr' and repeat the BLAST search. You won't have to change anything else if you have checked 'Show results in a new window.' Note that there is a good chance you will see fewer likely genes than with the FGENESH prediction.]
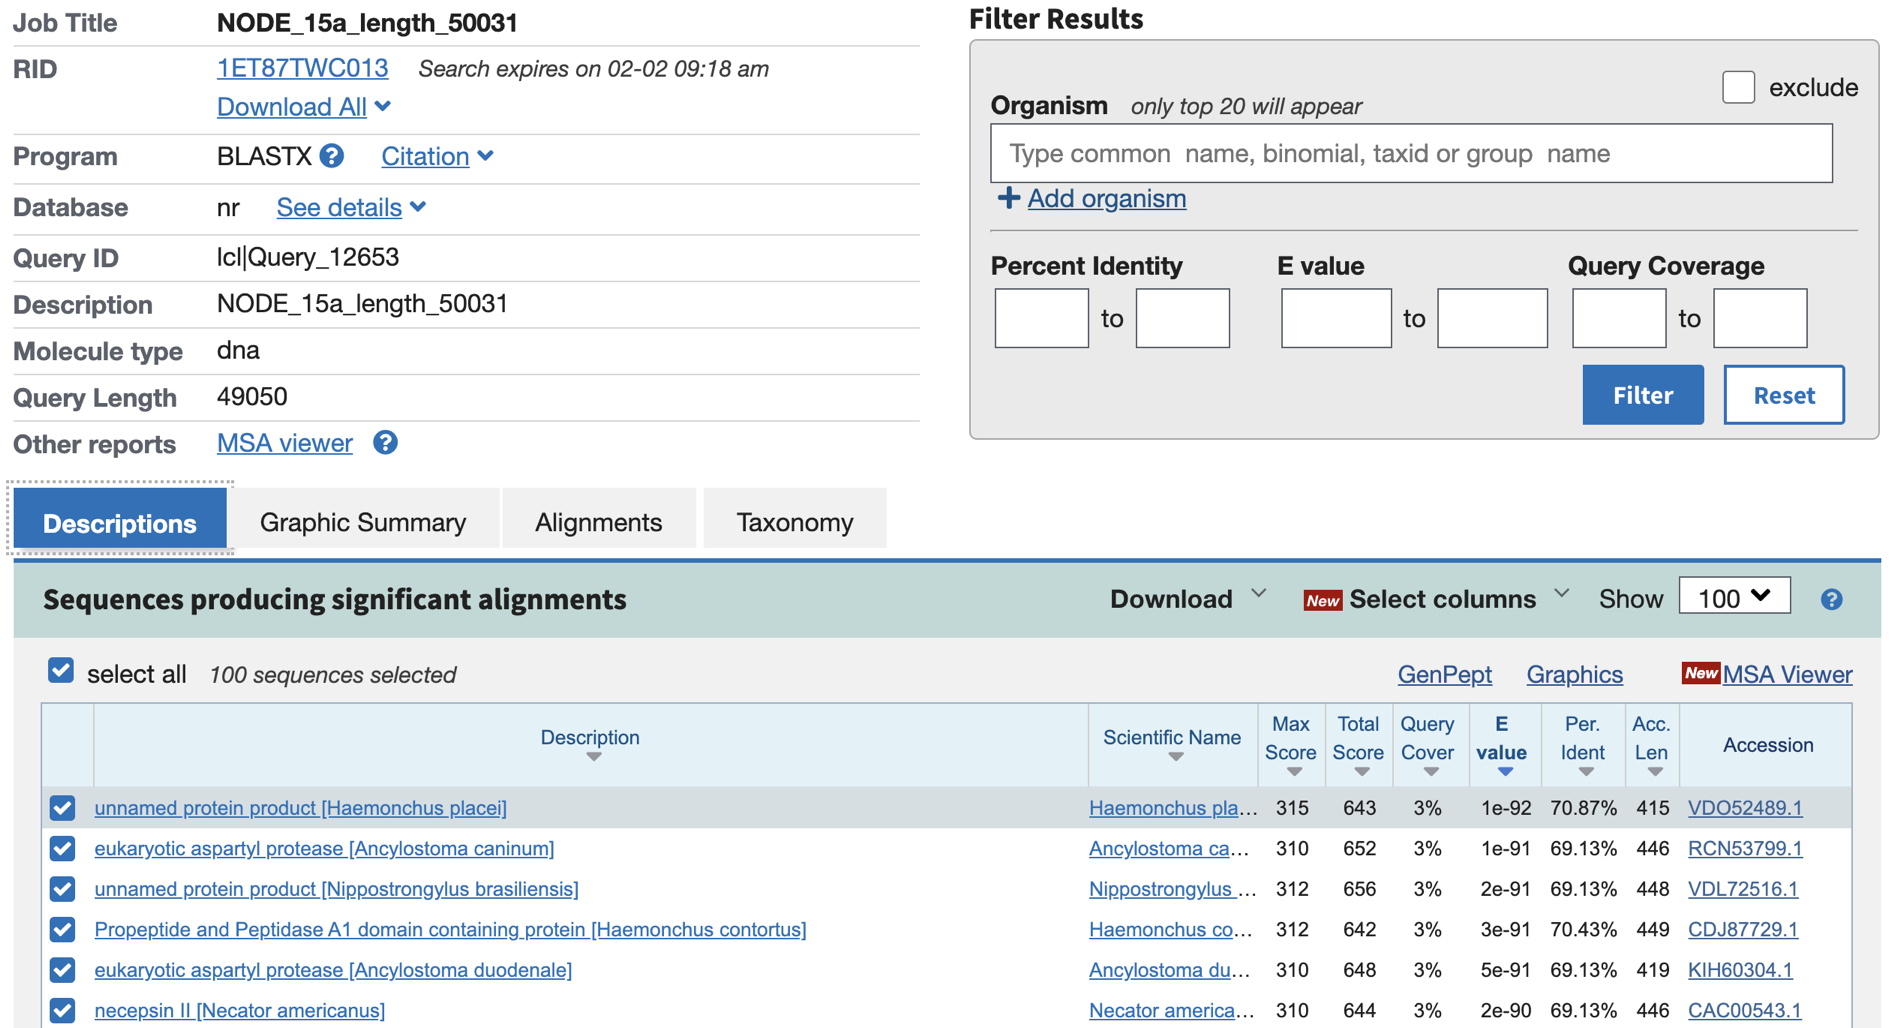
The intial result will look something like below, showing names for the other animal sequence that are homologous to parts of your large sequence in the Descriptions tab.

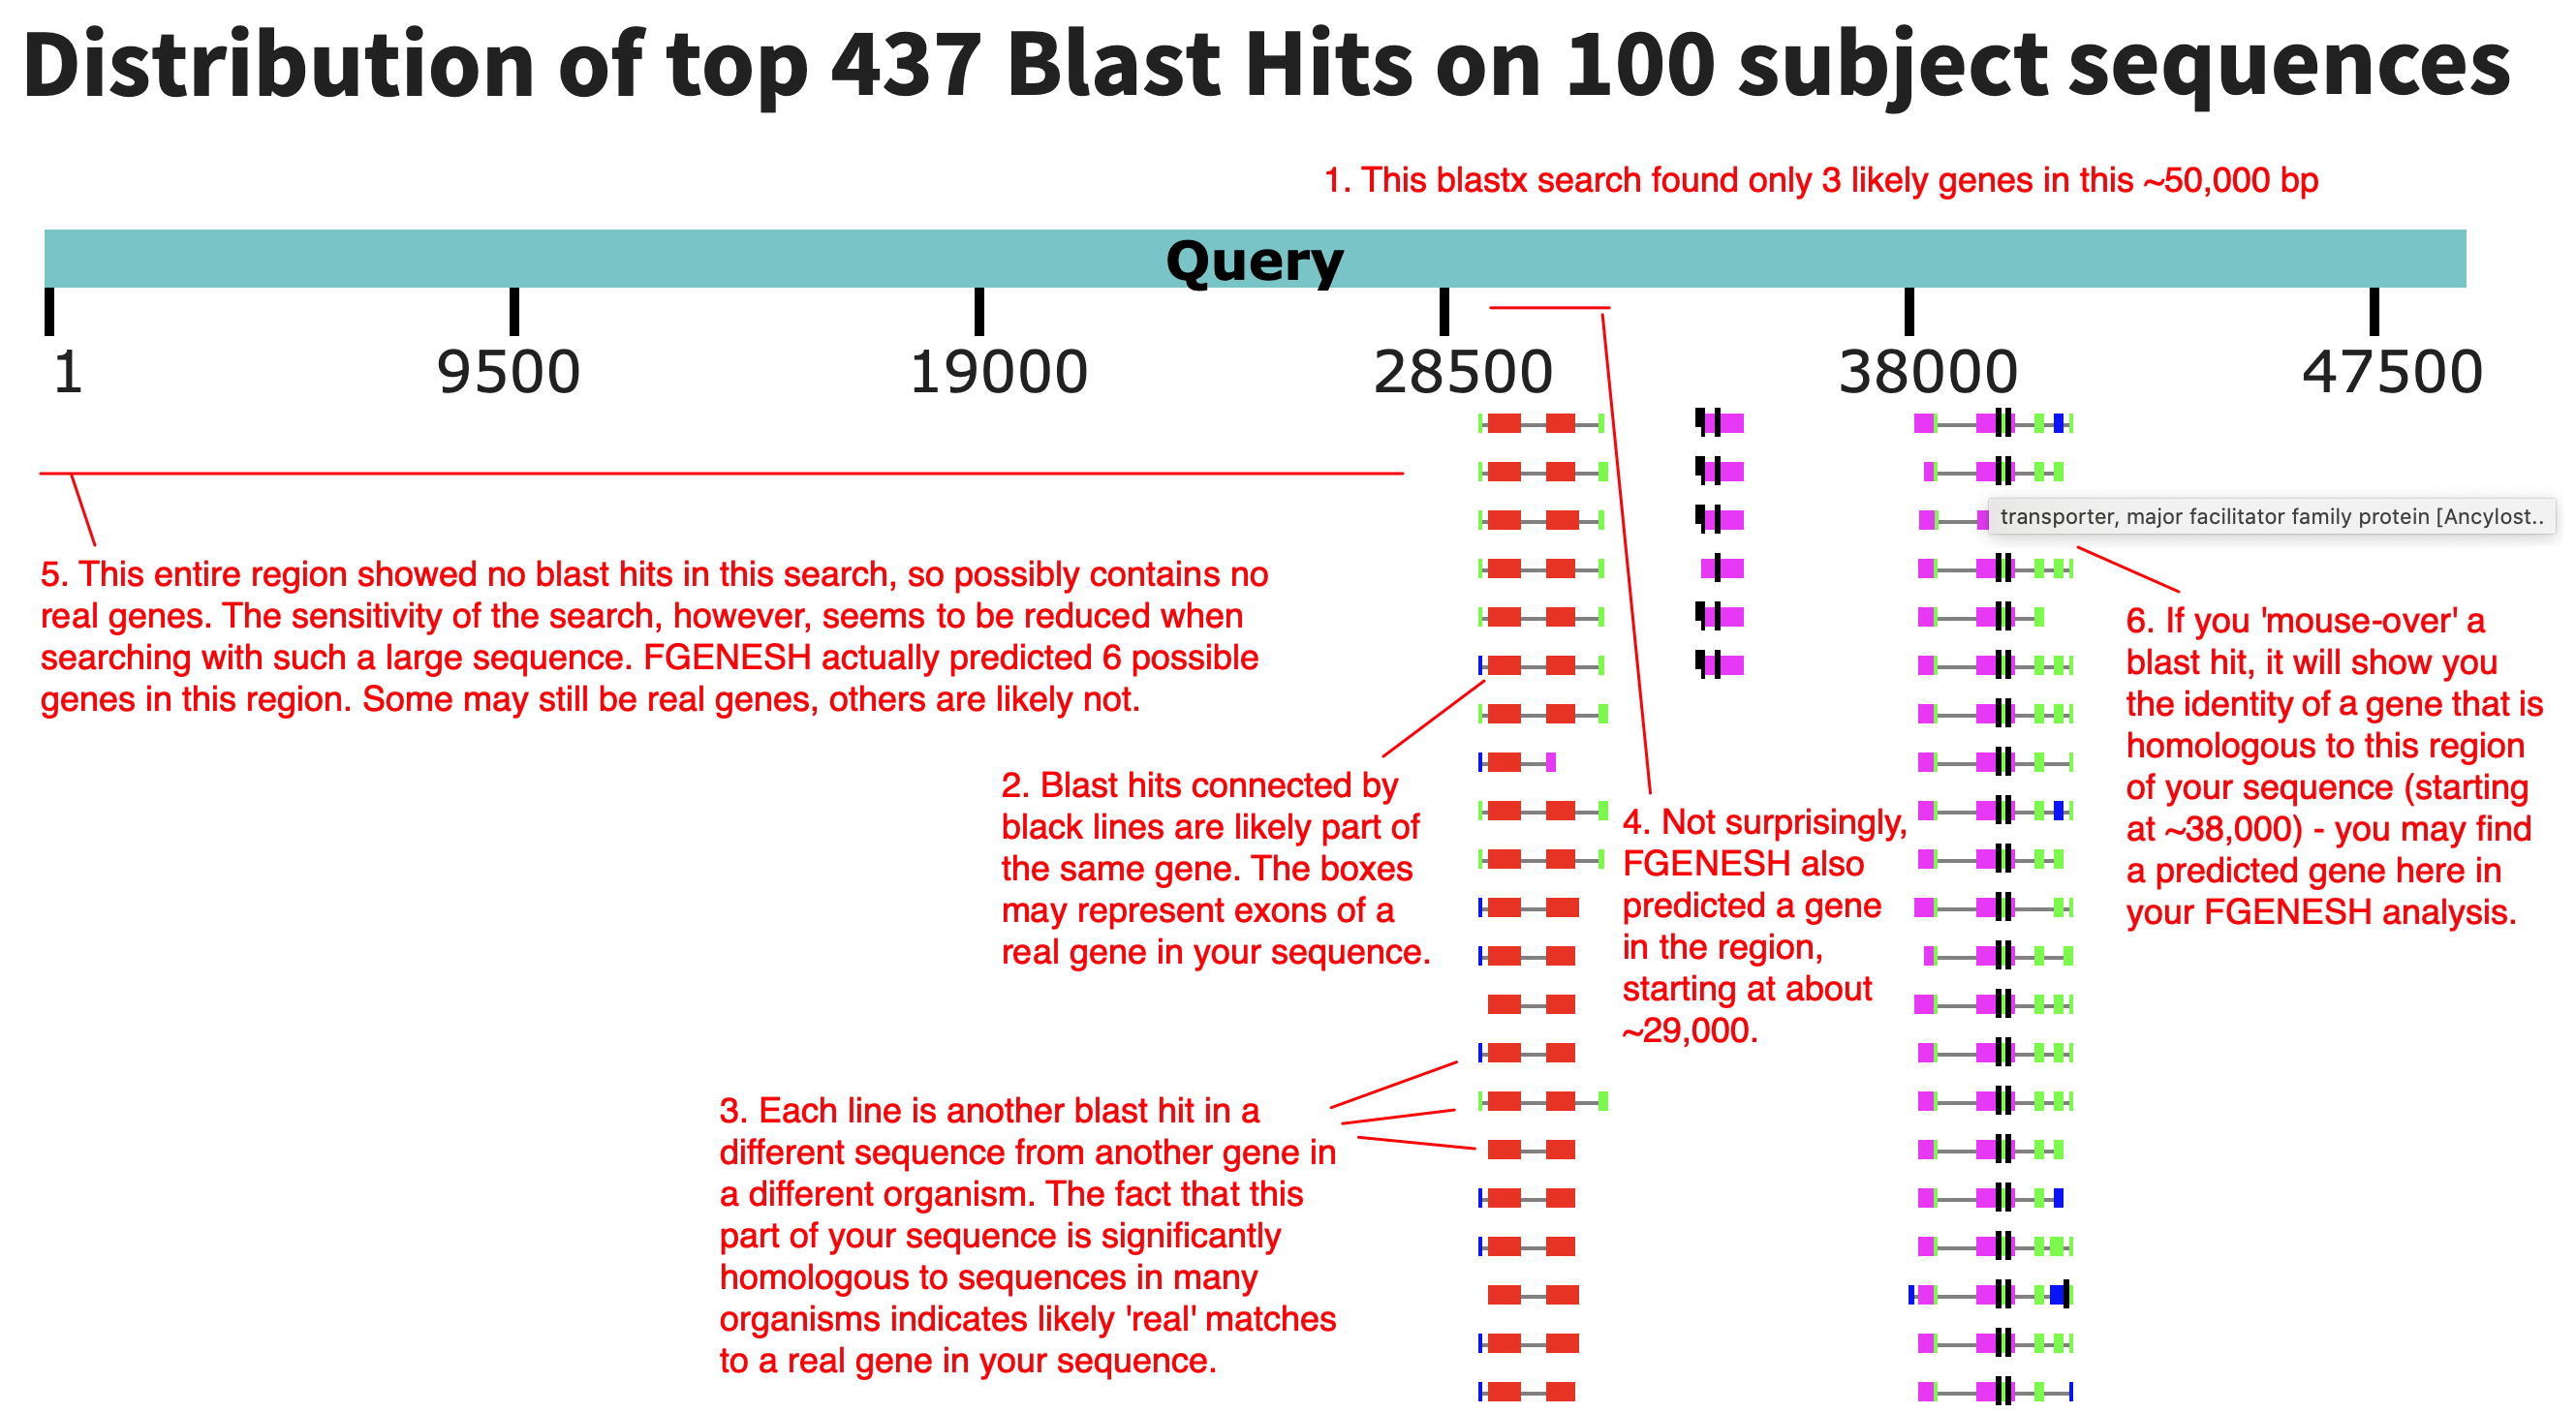
Now, select the Graphic Summary tab. (Note the color indicates the strength of the match, as shown in the key above.) Screenshot this portion of the Graphic Summary for a good overview of blast hits in your genomic sequence.

Below is an the graphic view with information on how to interpret the diagram.

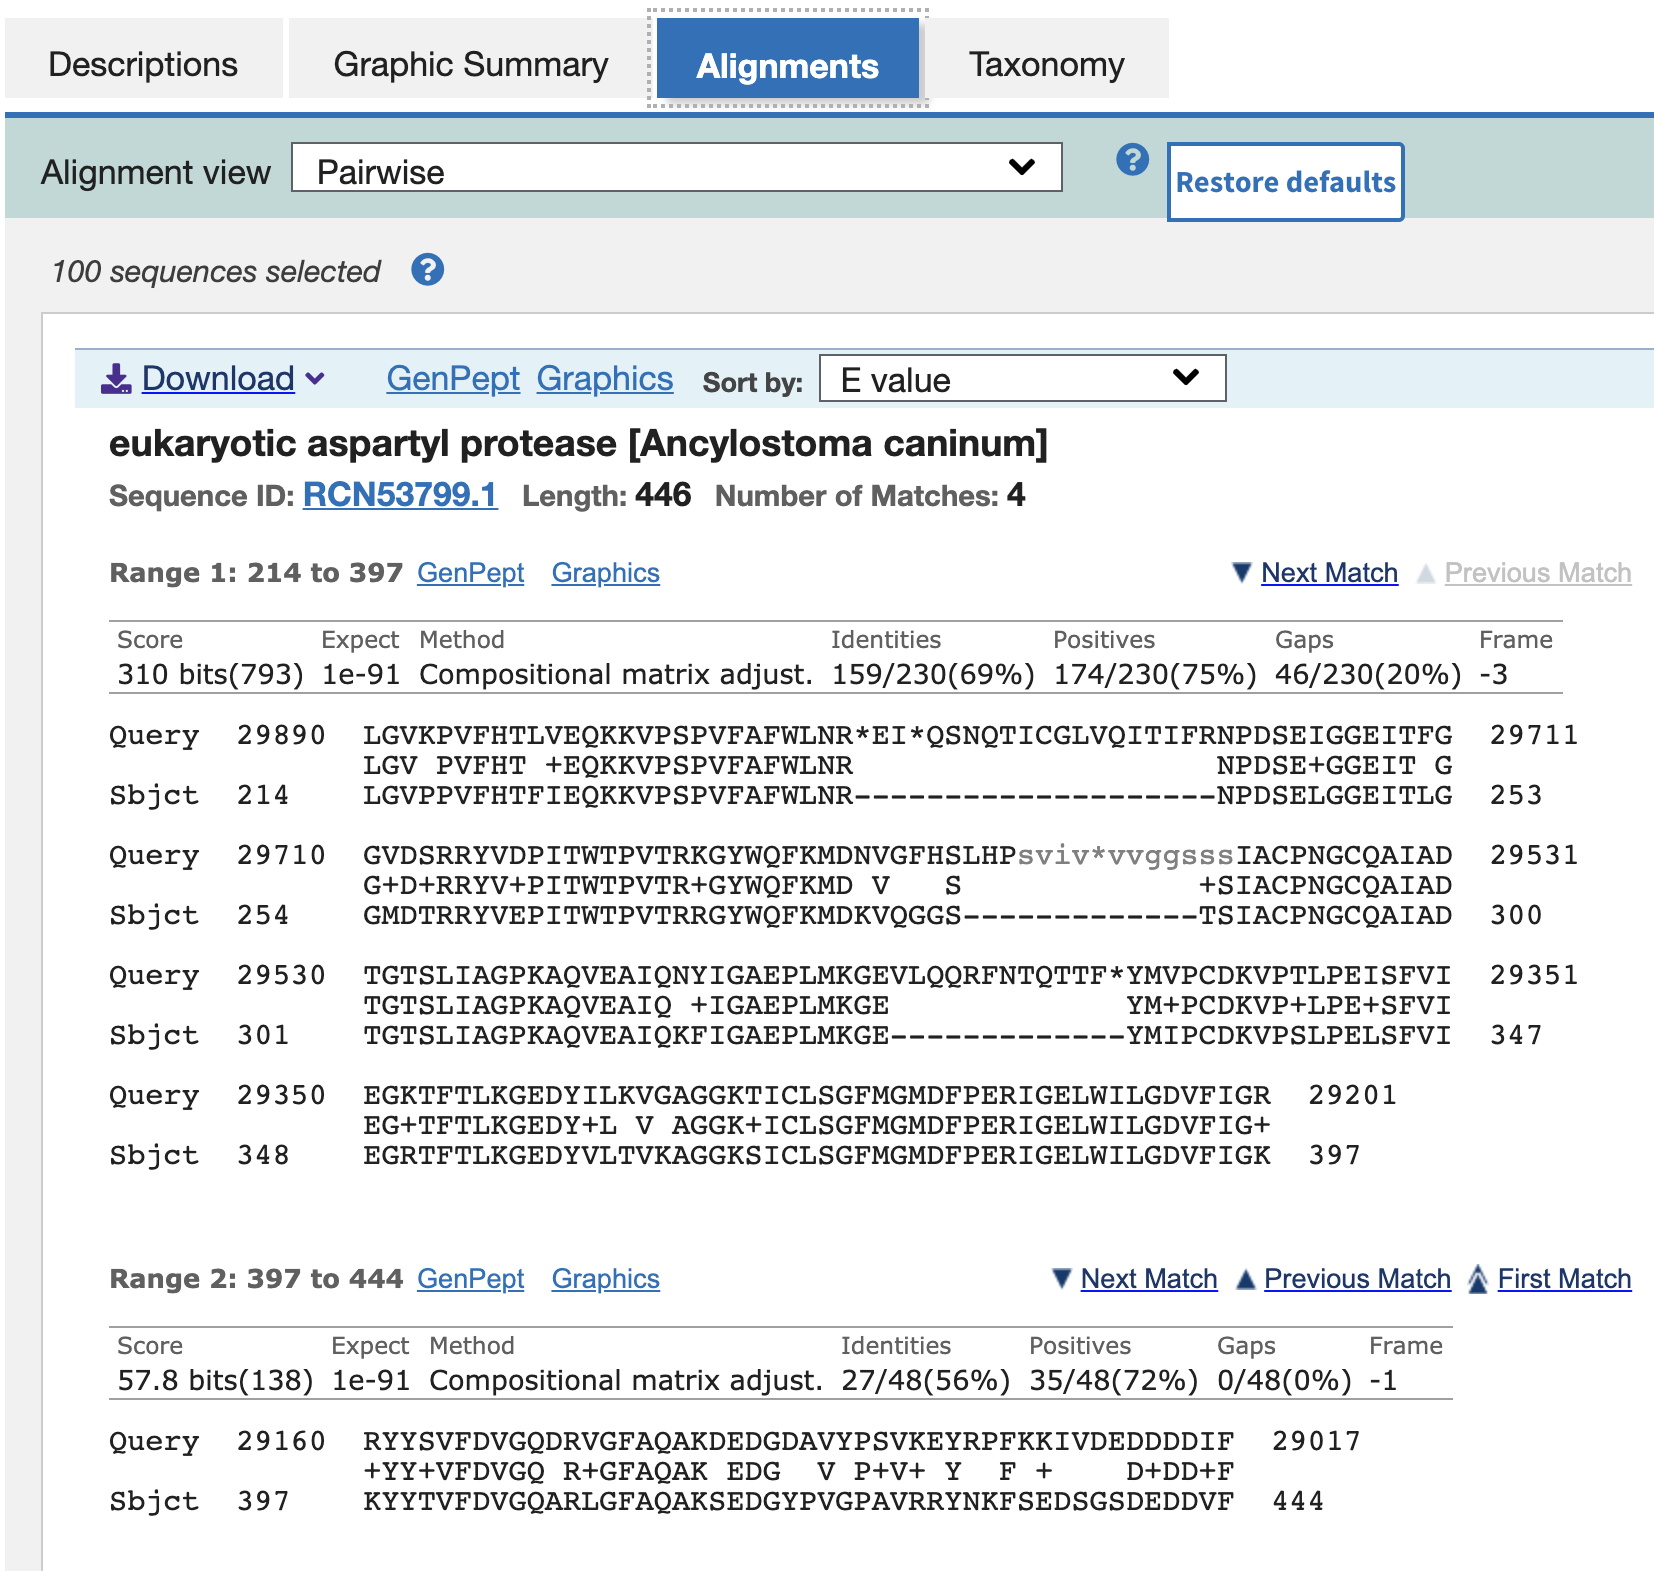
If you select the Alignments tab, you will see protein sequence alignments of translated protein sequences from ORFs in your sequence aligned with those of other organisms - the blast hits - starting with the highest scoring match. Note in this case it is in the ~29,000 bp region (red high-scoring matches in the graphical view). The first alignment starts at 29017 (see the end of the 'Range 2' alignment, the Query sequence). [Here we're showing the 2nd highest match, which has a meaningful description (eukaryotic aspartyl protease), rather than 'unnamed protein product.']

Optional: A more computation-intensive approach that can find matches with previously unidentified (never predicted) proteins would use tblastx. Are there any regions detected with TBLASTX that were not detected with BLASTX? Make a note of these regions, if found.
Using BLASTX on a large sequence (~50,000 bp) that compares everything at once can be a bit overwhelming initially - and, may be less sensitive than searches with smaller bits of sequence. The method below (7B) searches for matches to your predicted proteins one at a time.
B. Determine whether individual proteins predicted by FGENESH have matches in the protein database.
1. Go to the NCBI BLAST Server
2. Click on Protein BLAST (blastp).
3. Paste each predicted amino acid sequence from your FGENESH analysis individually into the large window under "Enter Query Sequence." All the other parameters can be left at their default settings.
4. Select the "Show results in a new window" checkbox, then click the BLAST button.
(Record which of your genes appear to encode proteins known from other organisms. Consider what 'E-values' represent genuine matches with related proteins vs. random matches.)
Optional: Note Conserved Domains found in your search. (This information may come up immediately after initiating the search in the 'Format' window.) This is a strong indication that your sequence encodes a real protein.