
  |
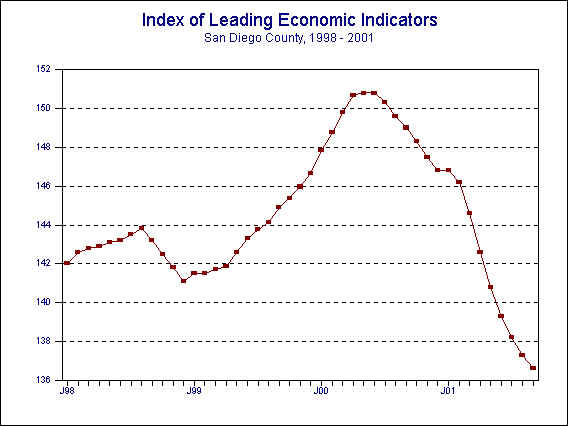
| November 20, 2001 -- The University of San Diego's Index of Leading Economic Indicators for San Diego County fell 0.5 percent in September. Big drops in local stock prices and initial claims for unemployment insurance led the move to the downside. Building permits and the outlook for the national economy were also down but to a lesser extent. On the positive side, two components were up during the month, with consumer confidence up sharply and help wanted advertising registering a smaller gain. |
|
 |
Index of Leading Economic
Indicators The index for San Diego County that includes the components listed below (September) Source: University of San Diego |
- 0.5 % |
 |
Building Permits
Residential units authorized by building permits in San Diego County (September) Source: Construction Industry Research Board |
- 0.41% |
 |
Unemployment Insurance
Initial claims for unemployment insurance in San Diego County, inverted (September) Source: Employment Development Department |
- 1.49% |
 |
Stock Prices San Diego Stock Exchange Index (September) Source: San Diego Daily Transcript |
- 1.77% |
 |
Consumer Confidence
An index of consumer confidence in San Diego County (September) Source: San Diego Union-Tribune |
+ 1.15% |
 |
Help Wanted Advertising
An index of help wanted advertising in the San Diego Union-Tribune (September) Source: Greater San Diego Chamber of Commerce |
+ 0.33% |
 |
National Economy
Index of Leading Economic Indicators (September) Source: The Conference Board |
- 0.82% |
With September’s decline, the USD Index of Leading Economic Indicators has now fallen for eight months in a row. The breadth of the decline remains negative although slightly improved over recent months, with four components down and two up. The outlook for the local economy mirrors that of the national economy, with weakness likely for the rest of 2001 and into the first half of 2002. This weakness will manifest itself in slower job growth and a higher local unemployment rate, which is likely to hit 4% sometime in the first half of 2002. Look for a recovery in the national economy and a return to robust growth in the local economy in the second half of 2002.
Highlights: The number of residential units authorized by building permits was down only 1.5% through the third quarter of 2001 compared to the same period last year. If the pace holds, total residential units authorized will top 15,000 for the third year in a row. . . September is usually the best month of the year for initial claims for unemployment insurance as the new school year begins. So the 13,770 claims filed during the month is less than some recent months. But on a seasonally adjusted basis, initial claims reached their highest level since December 1998. . . September’s increase in help wanted advertising broke a six month downward trend in that component. That still leaves the total number of help wanted ads down 16% through the end of the third quarter of 2001 compared to the same period in 2000. The county’s unemployment rate reached 3.5% in October, up from 2.9% for the same month last year. . . Local stock prices fell sharply along with the rest of the financial markets in the wake of the events of September 11. . . Because individual components can fluctuate wildly from month-to-month and can thus have a distorting effect on the Index, the data is put through a moving average process to smooth the data and determine longer term trends. This is similar to what is done with the national Index of Leading Economic Indicators. Thus, the trend in consumer confidence was strongly positive for the second straight month, even though the actual value of the local consumer confidence index was down. . . The national Index of Leading Economic Indicators dropped for the second month in a row amid signs of a recession for the national economy. Gross domestic product dropped at a 0.4% annual rate in the third quarter, and the fourth quarter is expected to bring even worse economic news. The two consecutive quarters of negative economic growth would meet the official definition of a recession for the national economy.
September's decrease puts the Index of Leading Economic Indicators for San Diego County at 136.6, down from August’s reading of 137.3. Revisions in building permits for June caused the Index value for that month to be revised downward to 139.3 from the previously reported 139.4, and the change for the month was revised from -1.0% to -1.1%. The fluctuations of the Index of Leading Economic Indicators for San Diego County for the last year are given below:
| Index | % Change | ||
| 2000 | SEP | 149.0 | -0.4% |
| OCT | 148.3 | -0.5% | |
| NOV | 147.5 | -0.6% | |
| DEC | 146.8 | -0.4% | |
| 2001 | JAN | 146.8 | +0.0% |
| FEB | 146.2 | -0.4% | |
| MAR | 144.6 | -1.2% | |
| APR | 142.6 | -1.4% | |
| MAY | 140.8 | -1.3% | |
| JUN | 139.3 | -1.1% | |
| JUL | 138.2 | -0.8% | |
| AUG | 137.3 | -0.6% | |
| SEP | 136.6 | -0.5% |

For more information on the University of San Diego's Index of Leading Economic Indicators, please contact:
| Professor Alan Gin
School of Business Administration University of San Diego 5998 Alcalá Park San Diego, CA 92110 |
TEL: (619) 260-4883 FAX: (619) 501-2954 E-mail: agin@home.com |