|
Home
Leading Economic Indicators
Down Sharply in July
Note: The tentative date for the
release of next month's
report is September 30.
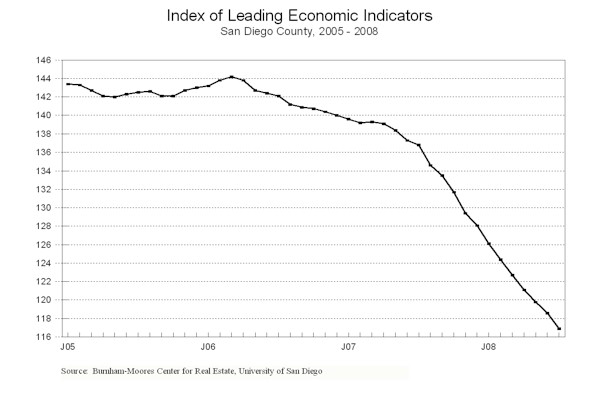
August 28, 2008 -- The University of San Diego's Index of
Leading Economic Indicators for San Diego County fell 1.5 percent in July.
Leading the way to the downside were sharp drops in consumer confidence,
initial claims for unemployment insurance, and the outlook for the national
economy. Two other components - -
local stock prices and help wanted advertising - - were also down moderately.
On the positive side, building permits were up, albeit only slightly so.
July’s drop was the tenth consecutive significant decrease in the USD
Index, which has fallen in 27 of the last 28 months.
 |
Index of Leading Economic
Indicators
The index for San Diego County that
includes the components listed below (July)
Source: University of San Diego |
- 1.5 % |
 |
Building Permits
Residential units authorized by building
permits in San Diego County (July)
Source: Construction Industry Research
Board |
+ 0.17% |
 |
Unemployment Insurance
Initial claims for unemployment insurance in San Diego
County, inverted (July)
Source: Employment Development Department |
- 1.89% |
 |
Stock Prices
San Diego Stock Exchange Index (July)
Source: San Diego Daily Transcript |
- 0.58% |
 |
Consumer Confidence
An index of consumer confidence in San
Diego County (July)
Source: San Diego Union-Tribune |
- 4.72% |
 |
Help Wanted Advertising
An index of online help wanted advertising in
San Diego (July)
Source: Monster Worldwide |
- 0.74% |
 |
National Economy
Index of Leading Economic Indicators (July)
Source: The Conference Board |
- 1.35% |
The outlook for the local economy continues to be negative,
with no signs of a rebound in sight.
Job growth remains negative, although most of the damage remains in the real
estate sectors (construction, lending, and real estate).
The only areas outside of real estate that are being adversely affected
have some connection to the housing slump, such as home furnishings and
appliance stores, as well as home improvement stores.
One positive development is the drop in gasoline prices, which have
fallen more than 70 cents per gallon since the peak earlier this summer.
Highlights:
The trend in residential units authorized by building permits was
positive for a second month in a row, even though the number of permits for July
was low. A moving average of the
data is used to capture trends and smooth random month-to-month fluctuations. .
. The news continues to be bad on both sides of the labor market.
The pace of job losses continues to be
high, as evidenced by elevated levels of initial claims for unemployment
insurance. Hiring remains weak,
with help wanted advertising falling for the 23rd month in a
row. The net result was that the
local unemployment rate jumped to 6.4 percent in July from a revised 6.0 percent
in June, marking the first time the unemployment rate has topped 6 percent since
the 1990s. . . Local consumer confidence continues to be at historically
low levels, and is down more than 50 percent from a year ago.
Historically, there has been a strong inverse correlation between local
consumer confidence and gasoline prices.
It remains to be seen whether the recent decline in local gasoline prices
will be enough to turn around the negative feelings among consumers. . .
Although local stock prices started to rebound towards the end of the
month, the average daily close for July was down compared to June. . . The
national Index of Leading Economic Indicators registered its largest drop
since August of last year. News on
the national economy remains mixed.
Although the advance estimate of Gross Domestic Product growth for the second
quarter of 2008 was a positive 1.9 percent, the first quarter growth was revised
downward to 0.9 percent and growth in the fourth quarter of 2007 was revised
downward to a negative 0.2 percent.
July’s decrease puts the USD Index of
Leading Economic Indicators for San Diego County at 116.9, down from June's
revised reading of 118.6. Revised data on building permits and the national
Index of Leading Economic Indicators led to revisions in the USD Index value for
April, May, and June, and to revisions in the previously reported changes for
April and May. Please visit the
Website address given below to see the revised changes for the individual
components. The values for the USD
Index for the last year are given below:
For more information on the University of San Diego's Index of Leading
Economic Indicators, please contact:
|