|
Home
Leading Economic Indicators
Down Sharply in March
Note:
The
tentative release date for next month's report is May 28.
April 30, 2009 --
The University of San Diego's
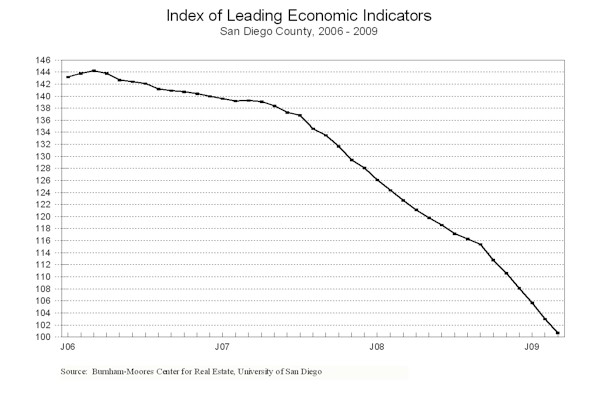
Index of Leading Economic Indicators for San Diego County fell 2.2 percent in
March. All six components in the Index
were down during the month, led by another record drop in help wanted
advertising. Consumer confidence
and initial claims for unemployment insurance were also sharply negative, while
there were more moderate drops in building permits, local stock prices, and the
outlook for the national economy.
March’s decline was the 35th decrease in the USD Index in 36 months.
It was also the sixth month in a row that the Index declined by more than
two percent, which corresponds to the six largest drops on record.
 |
Index of Leading Economic
Indicators
The index for San Diego County that
includes the components listed below (March)
Source: University of San Diego |
- 2.2 % |
 |
Building Permits
Residential units authorized by building
permits in San Diego County (March)
Source: Construction Industry Research
Board |
- 1.04% |
 |
Unemployment Insurance
Initial claims for unemployment insurance in San Diego
County, inverted, estimated (March)
Source: Employment Development Department |
- 2.31% |
 |
Stock Prices
San Diego Stock Exchange Index (March)
Source: San Diego Daily Transcript |
- 1.28% |
 |
Consumer Confidence
An index of consumer confidence in San
Diego County (March)
Source: San Diego Union-Tribune |
- 3.27% |
 |
Help Wanted Advertising
An index of online help wanted advertising in
San Diego (March)
Source: Monster Worldwide |
- 4.65% |
 |
National Economy
Index of Leading Economic Indicators (March)
Source: The Conference Board |
-0.61% |
The outlook for the local
economy remains strongly negative at this point with no turnaround in sight. The
bad job growth numbers for February got worse in March, with San Diego County
losing more than 44,000 jobs compared to the year before. Both the
national and local economies are caught in a vicious cycle where job losses are
reducing incomes, which reduces consumption, auto sales, and home sales, which
in turn leads to even more job losses. An added complication is the impact
on the already stressed financial system as more loans go bad in this scenario.
Highlights:
Residential units authorized by building permits rebounded after the two
worst months ever, but it was not enough to reverse the downward trend in that
component. Residential units authorized ended the first quarter down
almost 25 percent compared to the same period in 2008. While multi-family
units authorized were virtually unchanged (down 3 percent) for the period,
single-family permits were down over 43 percent compared to 2008. . . Both sides
of the labor market remain under heavy pressure as job losses mount and hiring
dries up. Initial claims for unemployment insurance topped 30,000
for the third consecutive month, while help wanted advertising fell for
the 31st month in a row. The net result was that the local
unemployment rate shot up to 9.3 percent in March from 8.9 percent in February.
. . The raw data on local consumer confidence was actually up in March
compared to February. But the USD Index uses a moving average of the data
to establish a trend by smoothing out random month-to-month fluctuations,
resulting in a negative trend for consumer confidence that has stretched for 23
straight months. . . Local stock prices turned downward as the broader
market averages hit a yearly low in early March. The subsequent rally off
those lows later in the month was not enough to break a modest two month up move
in local stocks. Despite that, local stocks prices ended the first quarter
up 3.6 percent, compared to a 13.3 percent drop in the Dow Jones Industrial
Average and a 3.1 percent decrease in the NASDAQ Composite Index. . . After
various revisions, the national Index of Leading Economic Indicators has
now fallen for three months in a row, and has now been down or unchanged for 11
consecutive months. The national economy continues to contract, with the
advance estimate for first quarter Gross Domestic Product down a worse than
expected 6.1 percent on an annualized basis. This follows a 6.3 percent
annualized drop in the fourth quarter of 2008.
March’s decrease
puts the USD Index of Leading Economic Indicators for San Diego County at 100.7,
down from February’s reading of 103.0. Revised data for building permits
and the national Index of Leading Economic Indicators led to a revision in the
value of the USD Index for January and the previously reported changes for
January and February. Please visit the Website address given below to see
the revised changes for the individual components. The values for the USD
Index for the last year are given below:
For more information on the University of San Diego's Index of Leading
Economic Indicators, please contact:
|